. 2009 Mar 15;81(6):2350-6.
doi: 10.1021/ac8026965.

Continuous-flow enzyme assay on a microfluidic chip for monitoring glycerol secretion from cultured adipocytes

Affiliations

Continuous-flow enzyme assay on a microfluidic chip for monitoring glycerol secretion from cultured adipocytes

Anna M Clark et al. Anal Chem. .

Abstract

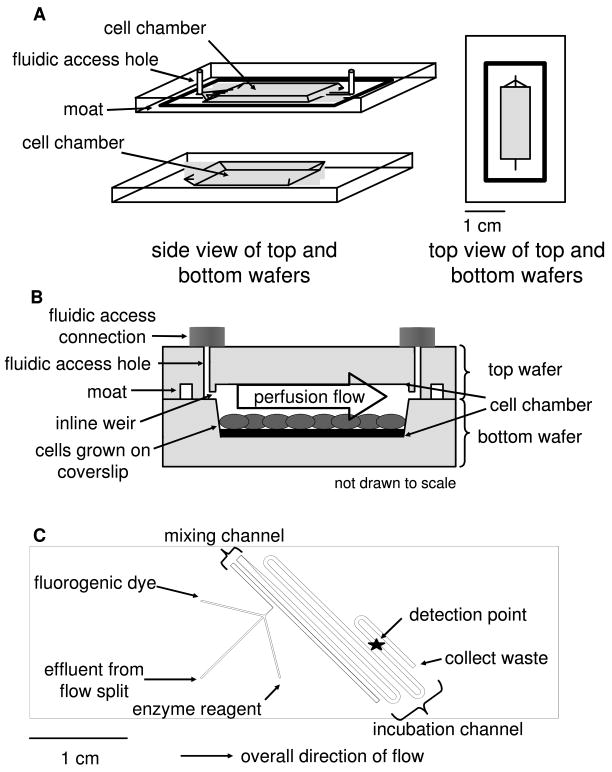
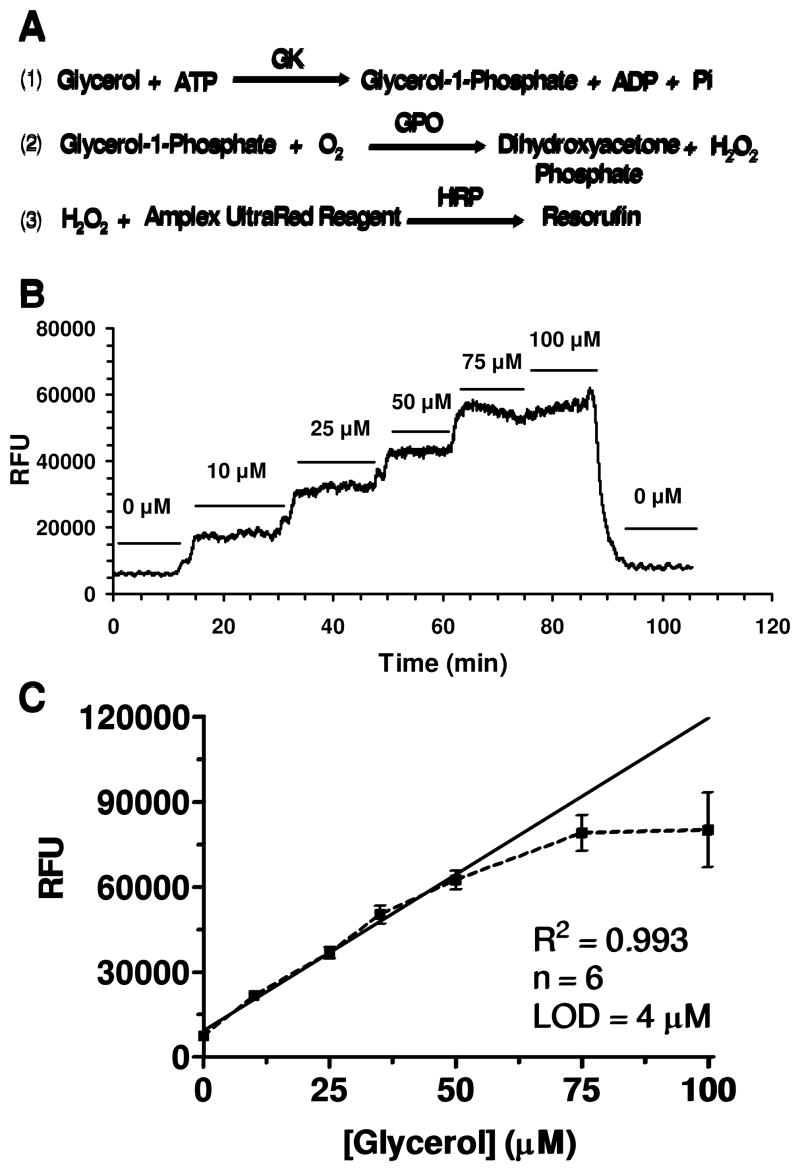
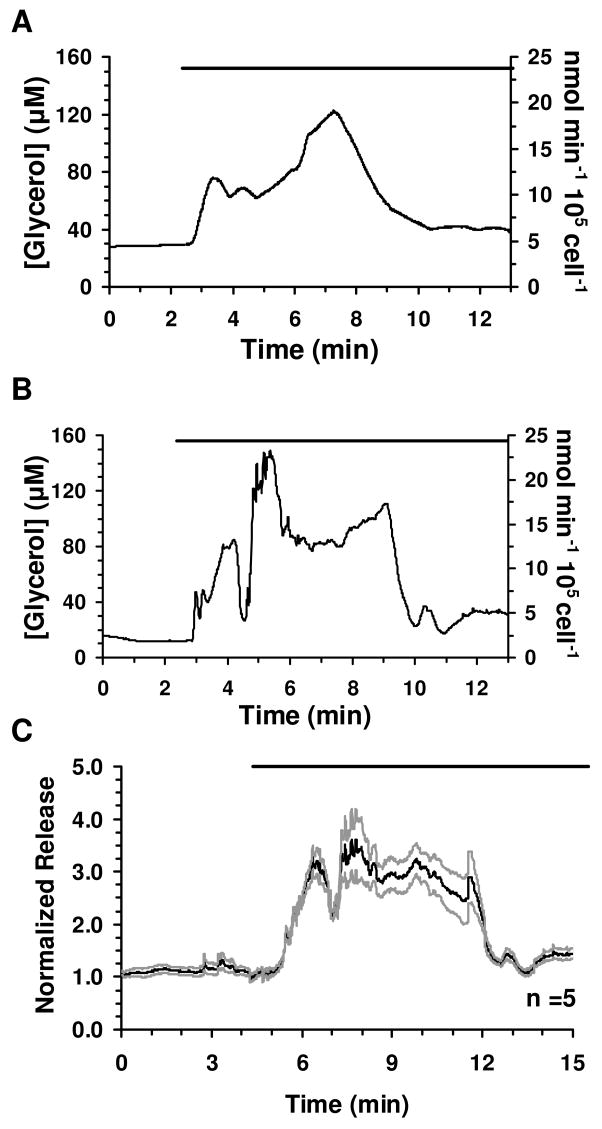
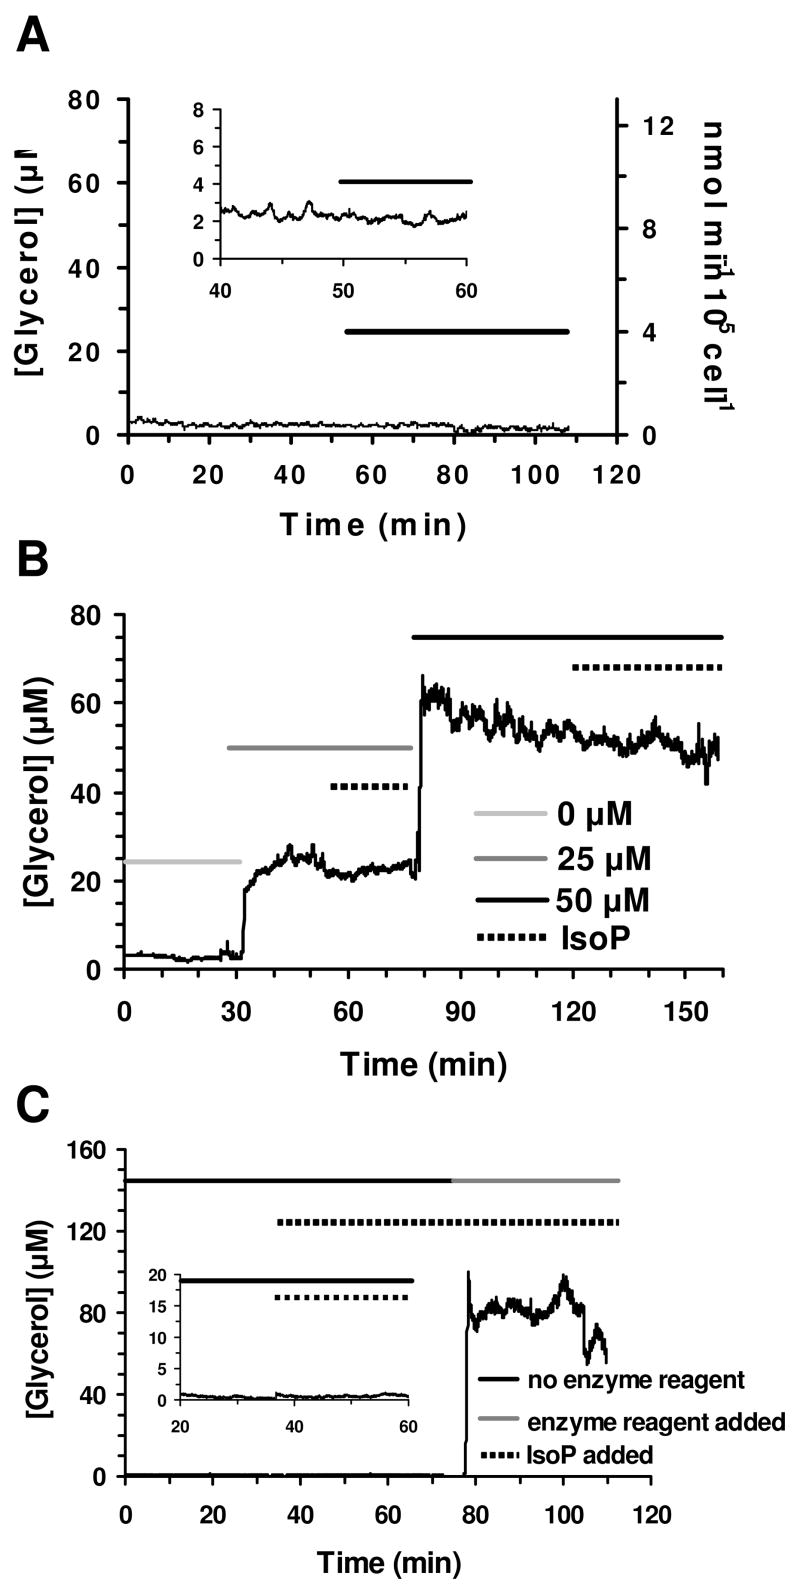
A dual-chip microfluidic platform that coupled perfusion of cultured adipocytes with on-line fluorescence-based enzyme assay was developed to monitor glycerol secretions in real time from cultured adipocytes. The perfusion cell chip, which could be reversibly sealed to allow reloading of cells and reuse of the chip, was shown by modeling to generate low shear stress on the cells under study. Effluent from the perfusion chip was pumped into an enzyme assay chip for monitoring of secretion from the cells. The on-line enzyme assay had a limit of detection (LOD) of 4 microM glycerol. The temporal resolution of the combined system for detecting changes in glycerol concentration was 90 s. The microfluidic device was used to continuously monitor glycerol secretion from murine 3T3-L1 adipocytes, grown and differentiated on glass coverslips, for at least 2 h. An average basal glycerol concentration of 28 microM was detected in the effluent. Pharmacological treatment with a beta-adrenergic agonist to stimulate lipolysis evoked a 3-fold increase in glycerol secretion followed by sustained release that was 40% higher than basal concentration. The ability to monitor changes in cellular secretion over time may provide insight into adipocyte metabolism and the dysregulation that occurs with obesity-related disorders.


Figures

Figure 1
Figure 1
Schematics of the two microfluidic devices used in this work. (a) A diagram of the perfusion cell chip depicts the two separate wafers employed in this work. The wafers were reversibly sealed with the aid of an in-house built compression frame. (b) A side view of the perfusion chip displays the cell chamber, which contained 50 000 differentiated adipocytes. Perfusion solution washed over the cells to sample secretions released from the cells. (c) The enzyme assay chip was capable of performing on-line mixing of three solutions and on-line detection of the enzymatic product. The layout shows the initial mixing channel connected to the incubation channel.
Figure 2
Figure 2
Characterization of on-line fluorescence-based enzyme assay. (a) The scheme of the fluorescence-based enzyme assay for glycerol employed for on-chip mixing and detection is depicted. Glycerol kinase (GK), glycerol phosphate oxidase (GPO), peroxidase (HRP), and Amplex UltraRed were mixed on-chip with glycerol (either from standards or cell effluent) to form the fluorescent product resorufin. (b) An example step-change calibration utilizing the dual-chip system is shown. Glycerol concentrations ranging between 0–100 μM were perfused through the system to determine the corresponding changes in fluorescence. (c) The overall calibration generated a LOD of 4 μM and was linear from 0–50 μM glycerol.
Figure 3
Figure 3
Glycerol secretion data from differentiated adipocytes and response to isoproterenol treatment. (a, b) Representative traces of glycerol release from differentiated adipocytes and response upon 20 μM isoproterenol treatment are shown. (c) Five glycerol secretion traces were averaged and shown with ± SEM. The SEM above and below the average was plotted to enable visualization of the error between measurements. The bars above traces represent exposure to 20 μM isoproterenol. The traces were shortened to depict only the time surrounding the initial exposure to isoproterenol.
Figure 4
Figure 4
Control secretion data. (a) Glycerol secretion data was obtained from 95% confluent preadipocytes. The bar indicates perfusion of 20 μM isoproterenol. The y-axis of the insert is 10x greater to enable visualization of the glycerol release measured. (b) The effect of isoproterenol introduction on the on-line enzyme assay was determined to be minimal at both 25 μM and 50 μM glycerol. The light grey line indicates perfusion of 0 μM glycerol standard, medium grey 25 μM, and black 50 μM, respectively. The dashed line represents exposure to 20 μM isoproterenol. (c) The response of the system without the enzyme reagent present and upon inclusion of the enzyme reagent during a cellular secretion experiment was tested. The black and grey lines represent the absence and presence of the enzyme reagent, respectively. The dashed line represents treatment with 20 μM isoproterenol. The y-axis scale of the insert is 8x greater for visualization of the release monitored when isoproterenol was introduced in the absence of the enzyme reagent.

References

    1. Davidsson R, Boketoft A, Bristulf J, Kotarsky K, Olde B, Owman C, Bengtsson M, Laurell T, Emneus J. Anal Chem. 2004;76:4715–4720. - PubMed
    1. Cheng W, Klauke N, Sedgwick H, Smith GL, Cooper JM. Lab Chip. 2006;6:1424– 1431. - PubMed
    1. Lau AY, Hung PJ, Wu AR, Lee LP. Lab Chip. 2006;6:1510–1515. - PubMed
    1. El-Ali J, Sorger PK, Jensen KF. Nature. 2006;442:403–411. - PubMed
    1. Kim L, Toh YC, Voldman J, Yu H. Lab Chip. 2007;7:681–694. - PubMed

Publication types