

Evolution of multiple phosphodiesterase isoforms in stickleback involved in cAMP signal transduction pathway
- PMID: 19232106
- PMCID: PMC2653465
- DOI: 10.1186/1752-0509-3-23
Evolution of multiple phosphodiesterase isoforms in stickleback involved in cAMP signal transduction pathway
Abstract
Background: Duplicate genes are considered to have evolved through the partitioning of ancestral functions among duplicates (subfunctionalization) and/or the acquisition of novel functions from a beneficial mutation (neofunctionalization). Additionally, an increase in gene dosage resulting from duplication may also confer an advantageous effect, as has been suggested for histone, tRNA, and rRNA genes. Currently, there is little understanding of the effect of increased gene dosage on subcellular networks like signal transduction pathways. Addressing this issue may provide further insights into the evolution by gene duplication.
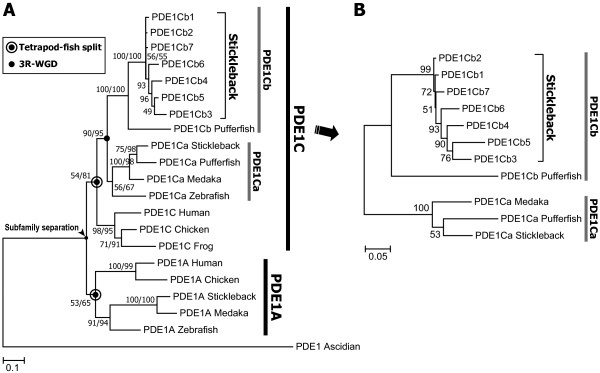
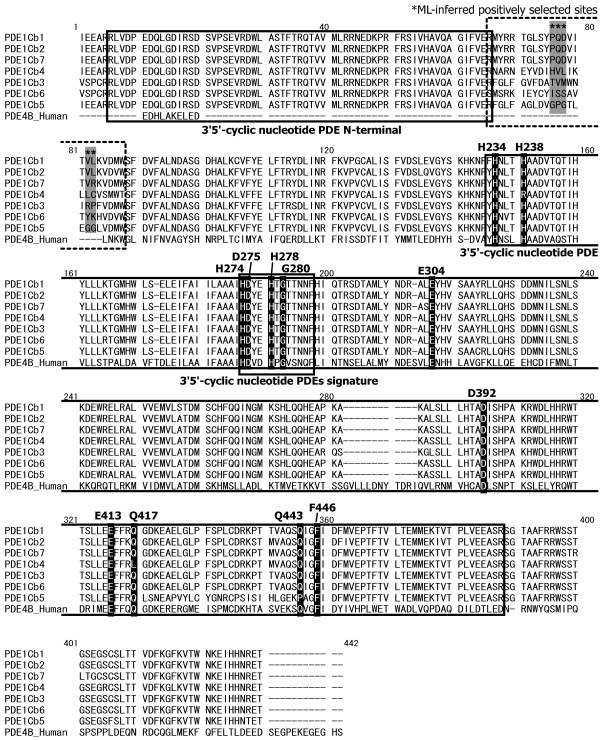
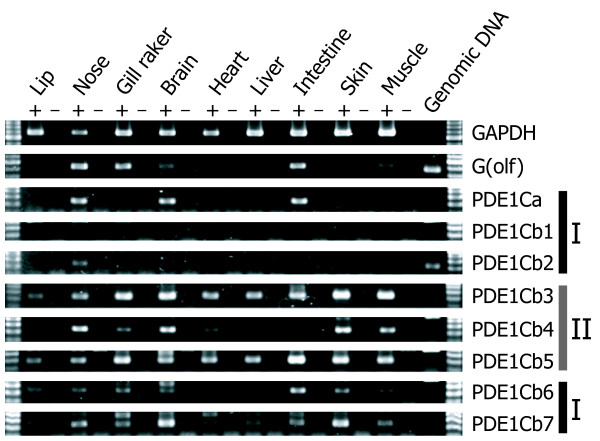
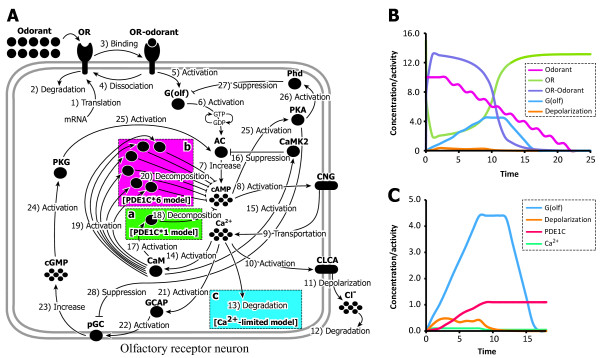
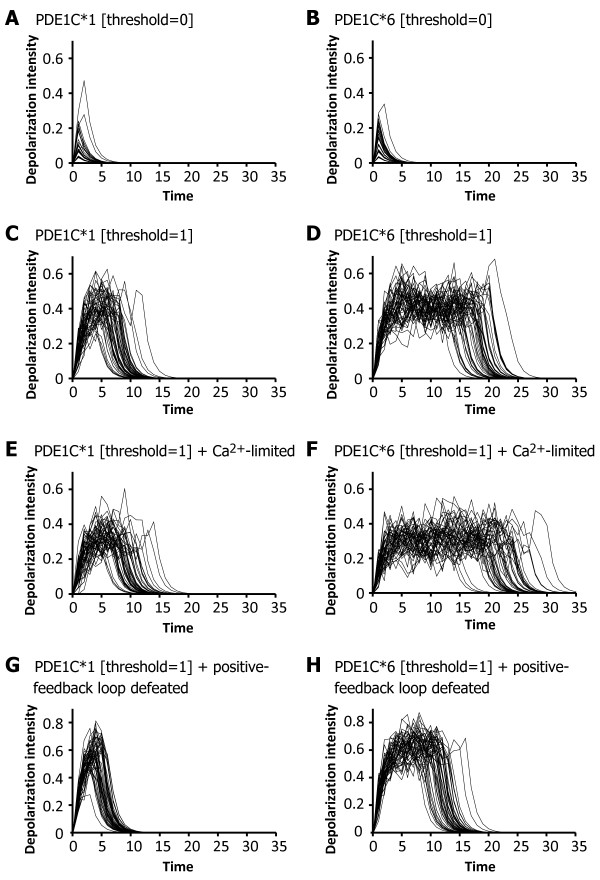
Results: We analyzed the evolution of multiple stickleback phosphodiesterase (PDE, EC: 3.1.4.17) 1C genes involved in the cyclic nucleotide signaling pathway. Stickleback has 8-9 copies of this gene, whereas only one or two loci exist in other model vertebrates. Our phylogenetic and synteny analyses suggested that the multiple PDE1C genes in stickleback were generated by repeated duplications of >100-kbp chromosome segments. Sequence evolution analysis did not provide strong evidence for neofunctionalization in the coding sequences of stickleback PDE1C isoforms. On the other hand, gene expression analysis suggested that the derived isoforms acquired expression in new organs, implying their neofunctionalization in terms of expression patterns. In addition, at least seven isoforms of the stickleback PDE1C were co-expressed with olfactory-type G-proteins in the nose, suggesting that PDE1C dosage is increased in the stickleback olfactory transduction (OT) pathway. In silico simulations of OT implied that the increased PDE1C dosage extends the longevity of the depolarization signals of the olfactory receptor neuron.
Conclusion: The predicted effect of the increase in PDE1C products on the OT pathway may play an important role in stickleback behavior and ecology. However, this possibility should be empirically examined. Our analyses imply that an increase in gene product sometimes has a significant, yet unexpected, effect on the functions of subcellular networks.
Figures

Similar articles
-
Extensive lineage-specific gene duplication and evolution of the spiggin multi-gene family in stickleback.BMC Evol Biol. 2007 Nov 4;7:209. doi: 10.1186/1471-2148-7-209. BMC Evol Biol. 2007. PMID: 17980047 Free PMC article.
-
Temporal pattern of loss/persistence of duplicate genes involved in signal transduction and metabolic pathways after teleost-specific genome duplication.BMC Evol Biol. 2009 Jun 5;9:127. doi: 10.1186/1471-2148-9-127. BMC Evol Biol. 2009. PMID: 19500364 Free PMC article.
-
Expression and activity of cAMP phosphodiesterase isoforms in pulmonary artery smooth muscle cells from patients with pulmonary hypertension: role for PDE1.Am J Physiol Lung Cell Mol Physiol. 2007 Jan;292(1):L294-303. doi: 10.1152/ajplung.00190.2006. Epub 2006 Sep 15. Am J Physiol Lung Cell Mol Physiol. 2007. PMID: 16980375
-
Biochemistry and physiology of cyclic nucleotide phosphodiesterases: essential components in cyclic nucleotide signaling.Annu Rev Biochem. 2007;76:481-511. doi: 10.1146/annurev.biochem.76.060305.150444. Annu Rev Biochem. 2007. PMID: 17376027 Review.
-
PDEs create local domains of cAMP signaling.J Mol Cell Cardiol. 2012 Feb;52(2):323-9. doi: 10.1016/j.yjmcc.2011.08.016. Epub 2011 Aug 23. J Mol Cell Cardiol. 2012. PMID: 21888909 Review.
Cited by
-
Fish lateral line innovation: insights into the evolutionary genomic dynamics of a unique mechanosensory organ.Mol Biol Evol. 2012 Dec;29(12):3887-98. doi: 10.1093/molbev/mss194. Epub 2012 Jul 27. Mol Biol Evol. 2012. PMID: 22844072 Free PMC article.
-
Temporal dynamics of neurogenomic plasticity in response to social interactions in male threespined sticklebacks.PLoS Genet. 2017 Jul 13;13(7):e1006840. doi: 10.1371/journal.pgen.1006840. eCollection 2017 Jul. PLoS Genet. 2017. PMID: 28704398 Free PMC article.
-
Chromosomal-Level Assembly of the Asian Seabass Genome Using Long Sequence Reads and Multi-layered Scaffolding.PLoS Genet. 2016 Apr 15;12(4):e1005954. doi: 10.1371/journal.pgen.1005954. eCollection 2016 Apr. PLoS Genet. 2016. PMID: 27082250 Free PMC article.
-
Whole-genome duplication and the functional diversification of teleost fish hemoglobins.Mol Biol Evol. 2013 Jan;30(1):140-53. doi: 10.1093/molbev/mss212. Epub 2012 Sep 4. Mol Biol Evol. 2013. PMID: 22949522 Free PMC article.
-
Network biology approach for identifying key regulatory genes by expression based study of breast cancer.Bioinformation. 2012;8(23):1132-8. doi: 10.6026/97320630081132. Epub 2012 Nov 23. Bioinformation. 2012. PMID: 23275709 Free PMC article.
References
-
- Ohno S. Evolution by Gene Duplication. New York: Springer-Verlag; 1970.
-
- Zhang J. Evolution by gene duplication: an update. Trends Ecol Evol. 2003;18:292–298.
Publication types
MeSH terms
Substances
LinkOut - more resources
Full Text Sources
Research Materials
