. 2009 Apr 3;387(3):744-58.
doi: 10.1016/j.jmb.2009.02.020. Epub 2009 Feb 20.

A non-sequence-specific DNA binding mode of RAG1 is inhibited by RAG2

Affiliations

A non-sequence-specific DNA binding mode of RAG1 is inhibited by RAG2

Shuying Zhao et al. J Mol Biol. .

Abstract

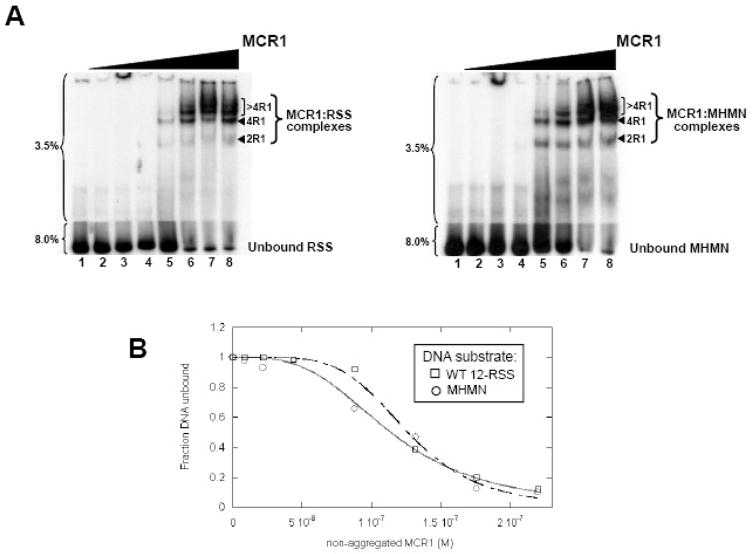
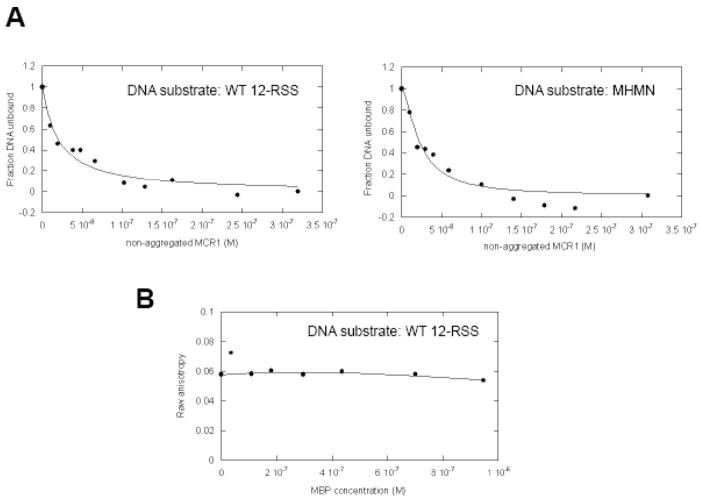
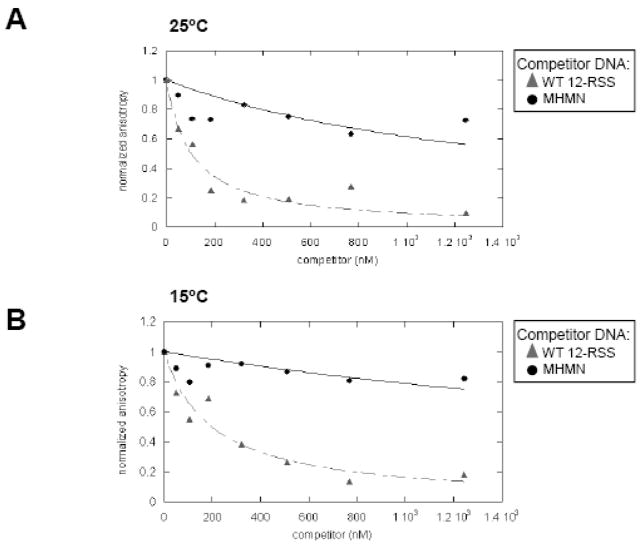
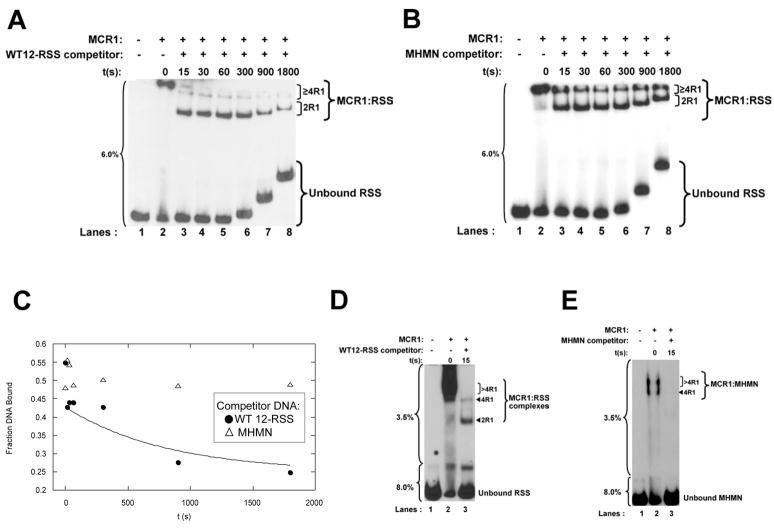
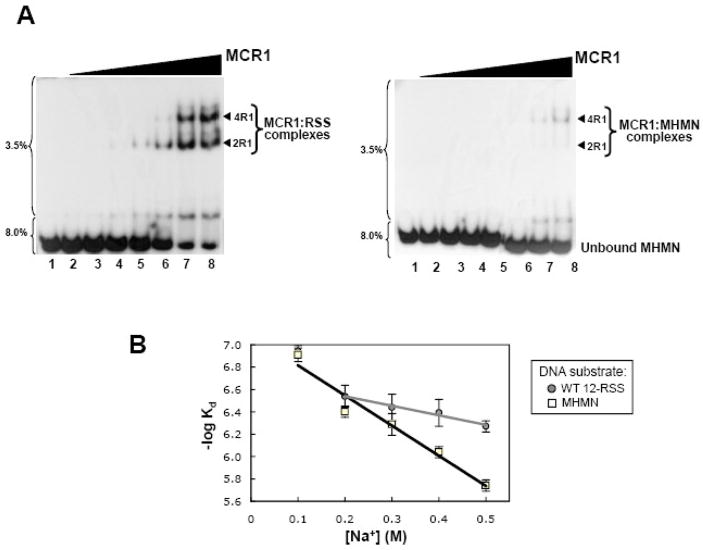
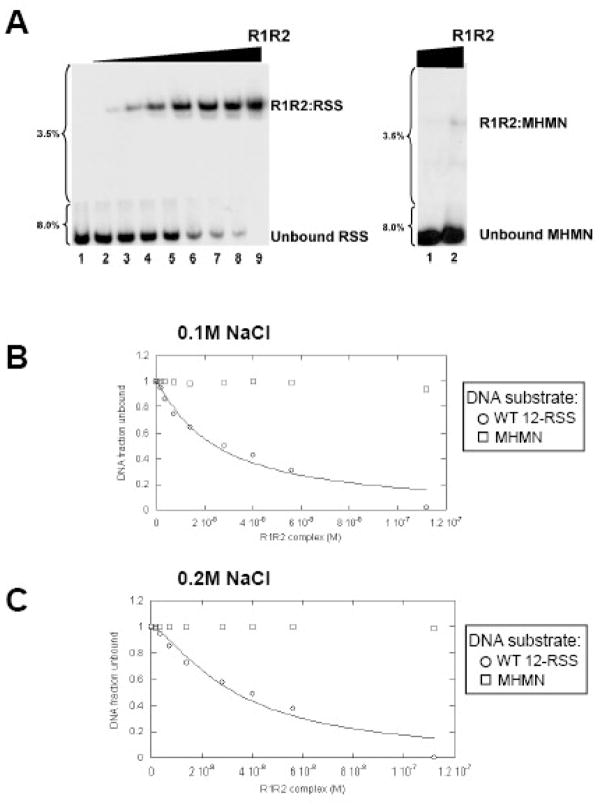
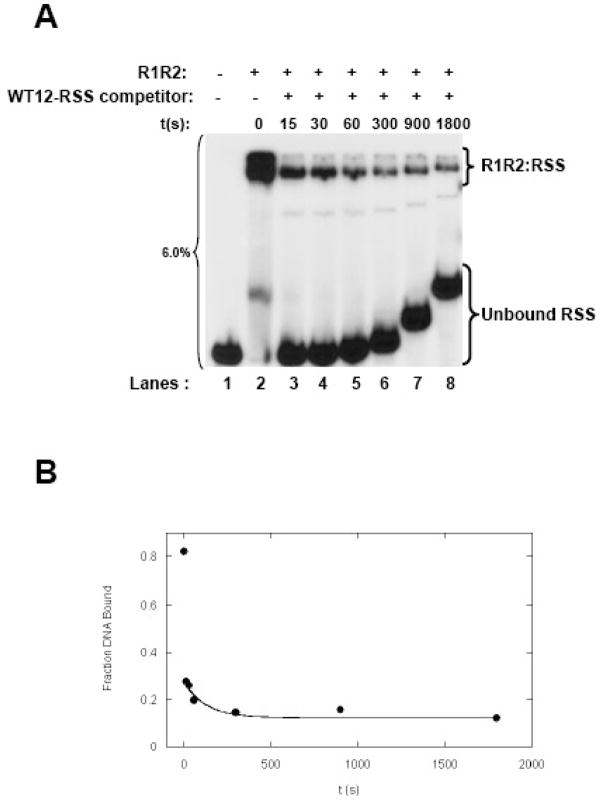
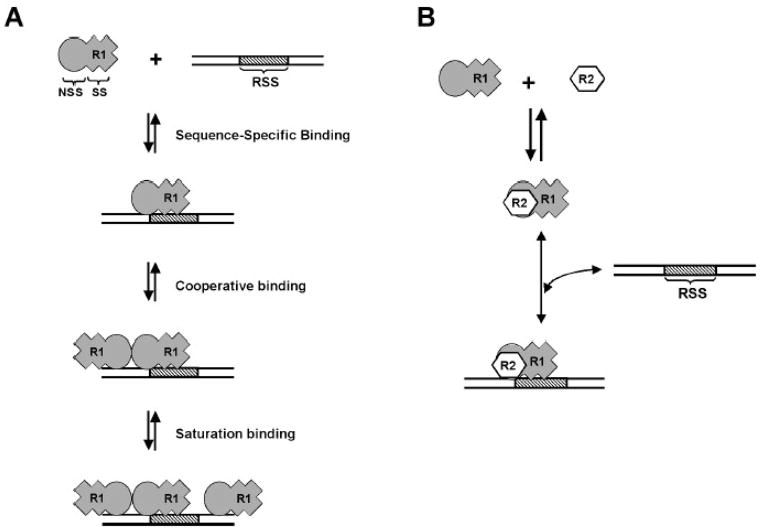
RAG1 and RAG2 proteins catalyze site-specific DNA cleavage reactions in V(D)J recombination, a process that assembles antigen receptor genes from component gene segments during lymphocyte development. The first step towards the DNA cleavage reaction is the sequence-specific association of the RAG proteins with the conserved recombination signal sequence (RSS), which flanks each gene segment in the antigen receptor loci. Questions remain as to the contribution of each RAG protein to recognition of the RSS. For example, while RAG1 alone is capable of recognizing the conserved elements of the RSS, it is not clear if or how RAG2 may enhance sequence-specific associations with the RSS. To shed light on this issue, we examined the association of RAG1, with and without RAG2, with consensus RSS versus non-RSS substrates using fluorescence anisotropy and gel mobility shift assays. The results indicate that while RAG1 can recognize the RSS, the sequence-specific interaction under physiological conditions is masked by a high-affinity non-sequence-specific DNA binding mode. Significantly, addition of RAG2 effectively suppressed the association of RAG1 with non-sequence-specific DNA, resulting in a large differential in binding affinity for the RSS versus the non-RSS sites. We conclude that this represents a major means by which RAG2 contributes to the initial recognition of the RSS and that, therefore, association of RAG1 with RAG2 is required for effective interactions with the RSS in developing lymphocytes.


Figures

Figure 1
Figure 1. MCR1 titration to WT 12-RSS versus MHMN as monitored by EMSA
(A) EMSA of radiolabeled WT-12RSS (left panel) and MHMN (right panel) titrated with MCR1. The radiolabeled DNA substrates were titrated with increasing concentrations of MCR1 (lanes 2–8 in each panel contained 8.8, 22, 44, 88, 132, 175, and 220 nM MCR1, respectively). The binding buffer contained 0.1 M NaCl. Subsequent to a 30 min incubation at room temperature, the reactions were subjected to electrophoresis on a two-part 3.5/8.0% polyacrylamide gel. The percentage of polyacrylamide is labeled to the left of each gel. The MCR1:RSS complexes are labeled according to the stoichiometry of MCR1 bound to a single RSS duplex. For example, 2R1 and 4R1 consist of 2 subunits (or a dimer) and 4 subunits, respectively, of MCR1 bound to the RSS duplex.,– Complexes containing greater than 4 bound MCR1 subunits per RSS duplex are labeled >4R1. (B) Representative plots of the fraction of unbound WT 12-RSS (open squares) and unbound MHMN (open circles) with increasing MCR1 concentrations. Binding curves of MCR1 with WT 12-RSS (dashed line) and MHMN (solid line) were fit to equation 4 to obtain Kd values (Kdapp) and Hill coefficient values (n). From three independent experiments, Kdapp = 114±5 nM (n=3±1) and Kdapp = 123±7 nM (n=4±1) for the association of MCR1 with WT 12-RSS and MHMN substrate, respectively.
Figure 2
Figure 2. MCR1 titrations to WT 12-RSS versus MHMN DNA as evaluated by fluorescence anisotropy methods
(A) Equilibrium binding of MCR1 to Oregon Green-labeled WT 12-RSS (left panel) and MHMN (right panel) substrates. Shown are the representative binding curves fit to equation 1 (in Materials and Methods) for the titration (at 25°C) of MCR1 into WT 12-RSS (left panel) and MHMN (right panel), with each DNA substrate at 4 nM. Binding curves were fit to equation 1 to obtain Kd values (Kdapp) and Hill coefficient values (n). From three independent experiments, Kdapp = 22±6 nM (n=1.0±0.3) and Kdapp = 24±6 nM (n=1.5±0.5) for the association of MCR1 with WT 12-RSS and MHMN substrate, respectively. (B) Addition of MBP does not increase the anisotropy of Oregon Green labeled WT 12-RSS. The raw anisotropy data versus MBP concentration is shown. The titration was performed at 25°C in the same buffer as in panel A.
Figure 3
Figure 3. Competition assays of a pre-formed MCR1:WT 12-RSS complex as monitored by fluorescence anisotropy
Representative plots depicting MCR1 (at 25 nM) complexed with Oregon Green-labeled WT 12-RSS (at 4 nM) titrated with unlabeled WT 12-RSS (filled triangles) or MHMN (filled circles) at 25°C (A) and 15°C (B). Equation 3 (see Materials and methods) was used to fit the competition data with the WT 12-RSS (dashed line) and MHMN (solid line) oligonucleotide duplexes as the competitors. In panel A, the value of Kc (derived from equation 3) with WT 12-RSS as competitor is 79 nM; the value of Kc with MHMN as competitor is estimated to be > 1200 nM. In panel B, Kc (with WT 12-RSS as competitor) is 150 nM, and Kc (with MHMN as competitor) is estimated to be > 2800 nM.
Figure 4
Figure 4. Kinetics of the dissociation of the MCR1:DNA complexes as a function of competitor DNA
(A and B) Time course of the dissociation of MCR1 bound to radiolabeled WT 12-RSS upon addition of a 120-fold molar excess of unlabeled competitor DNA, with the competitor either (A) WT 12-RSS or (B) MHMN. At the indicated timepoints aliquots of the sample were loaded onto a single-part 6% nondenaturing polyacrylamide gel. The percentage of polyacrylamide is labeled to the left of each gel. The difference in migration position of equivalent bands between lanes arises from loading of the sample aliquots sequentially on a running gel. The MCR1:RSS complexes are labeled as 2R1 for dimeric MCR1 per RSS duplex, and ≥4R1 for complexes containing 4 or more MCR1 subunits per RSS duplex. The 4R1 and >4R1 complexes denoted in Figure 1A are not easily resolved on the 6% gels, and are thus grouped together. (C) Kinetics of the dissociation of the MCR1:WT12-RSS complex with WT 12-RSS (filled circles) and MHMN (open triangles) substrates as competitor. The time course data with the WT 12-RSS duplex as competitor was fit to equation 5 (using data from Panel A). The time point range from 15 sec (first time point value obtained after addition of competitor) to 1800 sec was used to obtain the koff value. The ‘Fraction DNA Bound’ (Y-axis label) corresponds to DNA bound in all MCR1:RSS complexes. (D) The first time point in panel A was repeated on a two-part 3.5%/8% gel (as labeled to the left of the gel) and the respective MCR1:RSS complexes labeled as in Figure 1A. (E) The MCR1:MHMN complexes are not detected 15 sec after addition of a 120-fold excess of unlabeled MHMN competitor. The samples were resolved on a two-part 3.5%/8% nondenaturing polyacrylamide gel as labeled to the left of the gel.
Figure 5
Figure 5. Ionic strength dependence on MCR1:DNA complex formation
(A) Electrophoretic mobility shift assays of radiolabeled WT 12-RSS (left panel) and MHMN (right panel) titrated with MCR1 in binding buffer containing 0.4 M NaCl. The MCR1 concentration in lanes 2–8 in each panel was at 0.1, 0.2, 0.4, 0.6, 0.8, 1.2, and 1.6 μM, respectively. The MCR1:DNA complexes are labeled as in Figure 1A. (B) Plots of −log Kd versus NaCl concentration for the interaction of MCR1 with WT 12-RSS (gray circles) and MHMN (open squares). The error bars are from n=3 experiments. The linear least squares correlations are shown for the MCR1:MHMN association from 0.1–0.5 M NaCl (black line), and from 0.2–0.5 M NaCl for the MCR1:WT12-RSS association (gray line).
Figure 6
Figure 6. Titration of the R1R2 complex into WT 12-RSS versus MHMN substrate as monitored by EMSA
(A) Increasing concentrations of the R1R2 complex were titrated into either WT 12-RSS (left panel) or MHMN (right panel). R1 is MCR1 and R2 is GST-core RAG2 co-expressed and purified from 293T cells. The binding reactions were performed in buffer containing 0.1M NaCl. The concentration of the R1R2 complex (in terms of MCR1) in lanes 2–9 in the left panel was at 1.8, 3.5, 7, 14, 28, 40, 56, and 112 nM, respectively. Only the lanes containing 56nM (lane 1) and 112 nM (lane 2) of R1R2 complex concentrations are shown in the right panel, as protein-DNA complexes were not detected at lower concentrations. (B & C) Representative plots of the fraction of WT 12-RSS unbound (open circles) and MHMN unbound (open squares) with increasing concentrations of the R1R2 complex. The binding curves for the interaction of the R1R2 complex with the WT-12-RSS substrate (solid line) at either 0.1M NaCl (panel B) or 0.2 M NaCl (panel C) were fit to equation 4 as described in Materials and Methods. From three independent experiments, association of the R1R2 complex with WT 12-RSS yielded Kdapp = 25±5 nM (n=1.0±0.3) and Kdapp = 32±5 nM (n=1.5±0.3) at 0.1 M and 0.2 M NaCl, respectively.
Figure 7
Figure 7. Kinetics of the dissociation of the R1R2:WT 12-RSS as a function of competitor DNA
(A) Time course of the dissociation of reconstituted R1R2 complex bound to radiolabeled WT 12-RSS upon addition of a 120-fold molar excess of unlabeled WT 12-RSS competitor. At the indicated times, aliquots of the sample were loaded onto a 6% nondenaturing polyacrylamide gel. The difference in migration position of equivalent bands between lanes arises from loading of the sample aliquots sequentially on a running gel. (B) Kinetics of the dissociation of the reconstituted R1R2:WT 12-RSS complex. Representative plot of fraction DNA bound versus time was fit using data from Panel A as described in Figure 4.
Figure 8
Figure 8
Schematic model for the interaction of RAG1 alone and the RAG1:RAG2 complex with the RSS. (A) Dimeric core RAG1 (R1) contains sequence-specific (SS) and non-specific (NSS) DNA binding sites. In the first binding event shown, R1 forms sequence-specific contacts with the RSS through the SS DNA binding sites (corresponds to the ‘2R1’ MCR1:RSS complex in Fig. 1). Although not represented here, dimeric R1 can also bend the RSS substrate. In the next binding event shown, a second R1 dimer binds cooperatively forming protein-protein contacts with the sequence-specific bound R1 dimer (corresponds to the ‘4R1’ complex in Fig. 1). In the last binding event shown, additional R1 dimers may bind to the DNA substrate with high concentrations of protein (corresponds to ‘>4R1’ complexes in Fig. 1). (B) Complex formation of R1 with core RAG2 (R2) allows sequence-specific complex formation with the RSS, but blocks the high-affinity NSS DNA interactions, and the cooperative binding of a second R1 dimer.

References

    1. Gellert M. V(D)J recombination: RAG proteins, repair factors, and regulation. Annu Rev Biochem. 2002;71:101–132. - PubMed
    1. Fugmann SD, Lee AI, Shockett PE, Villey IJ, Schatz DG. The RAG proteins and V(D)J recombination: complexes, ends, and transposition. Annu Rev Immunol. 2000;18:495–527. - PubMed
    1. West RB, Lieber MR. The RAG-HMG1 complex enforces the 12/23 rule of V(D)J recombination specifically at the double-hairpin formation step. Mol Cell Biol. 1998;18:6408–6415. - PMC - PubMed
    1. Mundy CL, Patenge N, Matthews AGW, Oettinger MA. Assembly of the RAG1/RAG2 synaptic complex. Mol Cell Biol. 2002;22:69–77. - PMC - PubMed
    1. Jones JM, Gellert M. Ordered assembly of the V(D)J synaptic complex ensures accurate recombination. EMBO J. 2002;21:4162–4171. - PMC - PubMed

Publication types

MeSH terms

LinkOut - more resources