. 2009 May 15;46(1):177-92.
doi: 10.1016/j.neuroimage.2009.02.010. Epub 2009 Feb 20.

MRI-derived measurements of human subcortical, ventricular and intracranial brain volumes: Reliability effects of scan sessions, acquisition sequences, data analyses, scanner upgrade, scanner vendors and field strengths

Affiliations

MRI-derived measurements of human subcortical, ventricular and intracranial brain volumes: Reliability effects of scan sessions, acquisition sequences, data analyses, scanner upgrade, scanner vendors and field strengths

Jorge Jovicich et al. Neuroimage. .

Abstract

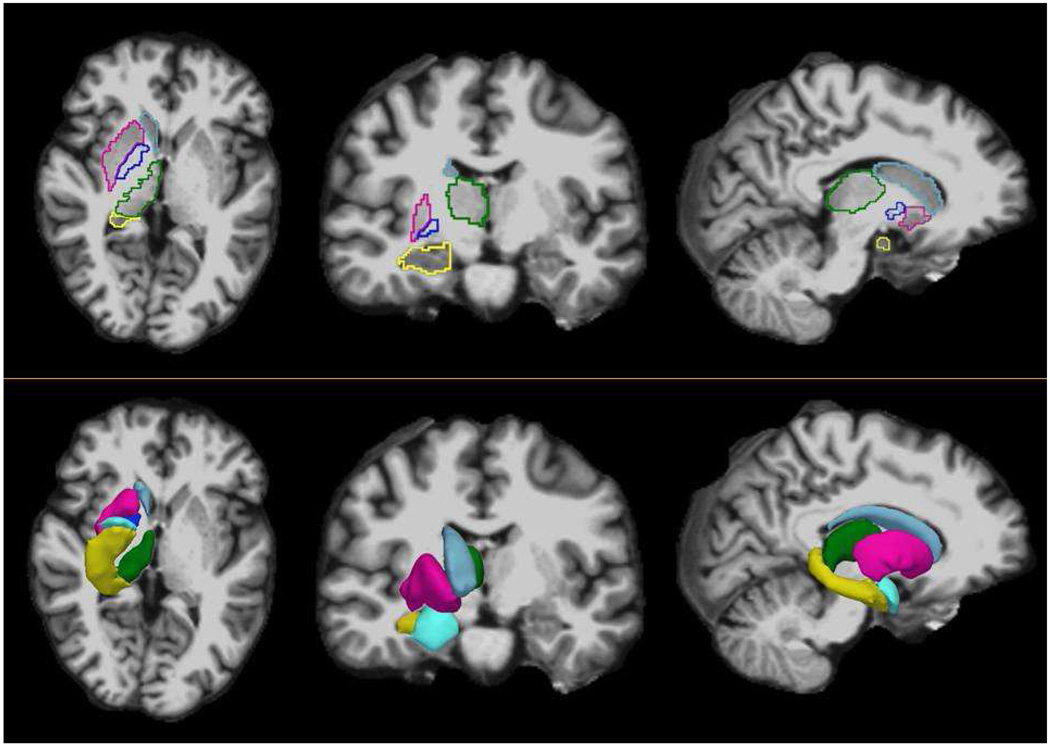
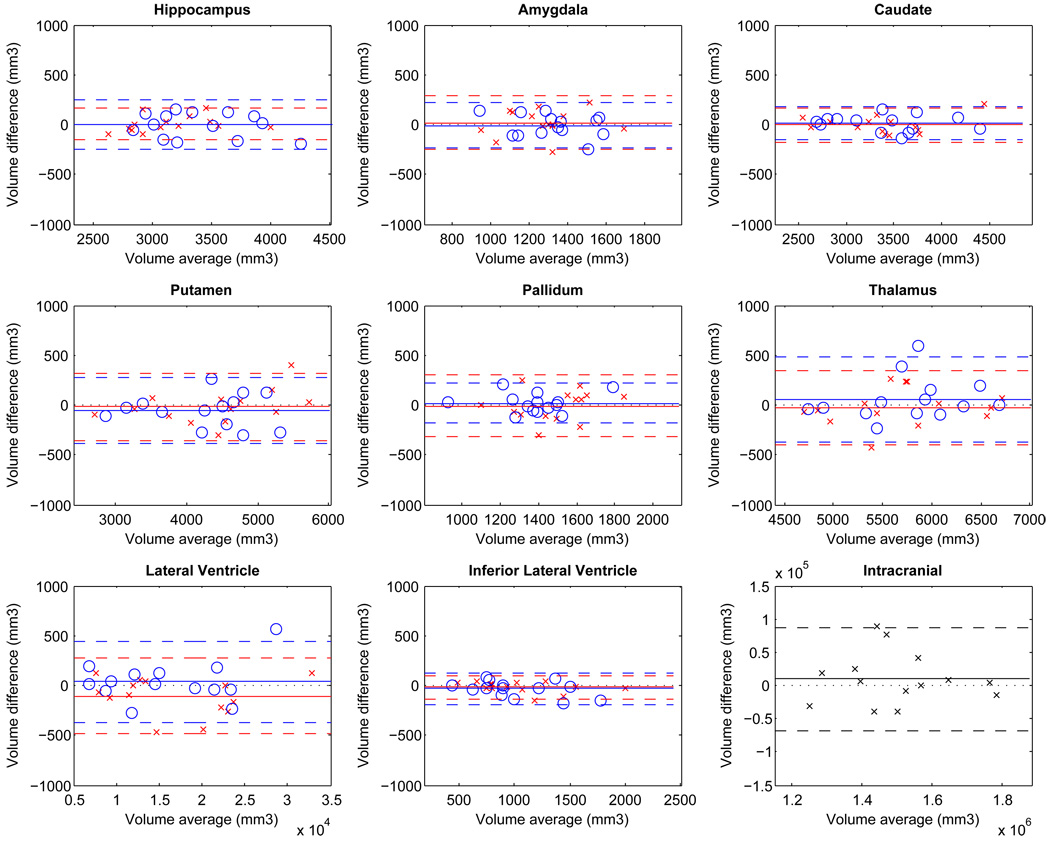
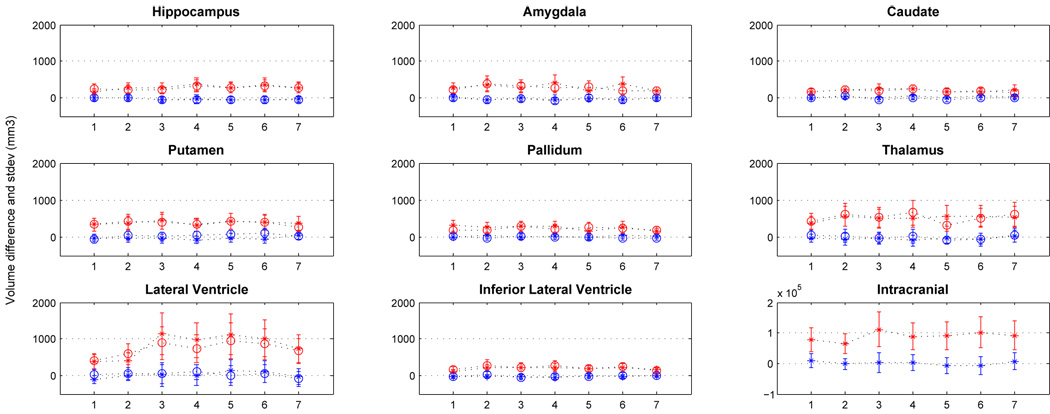
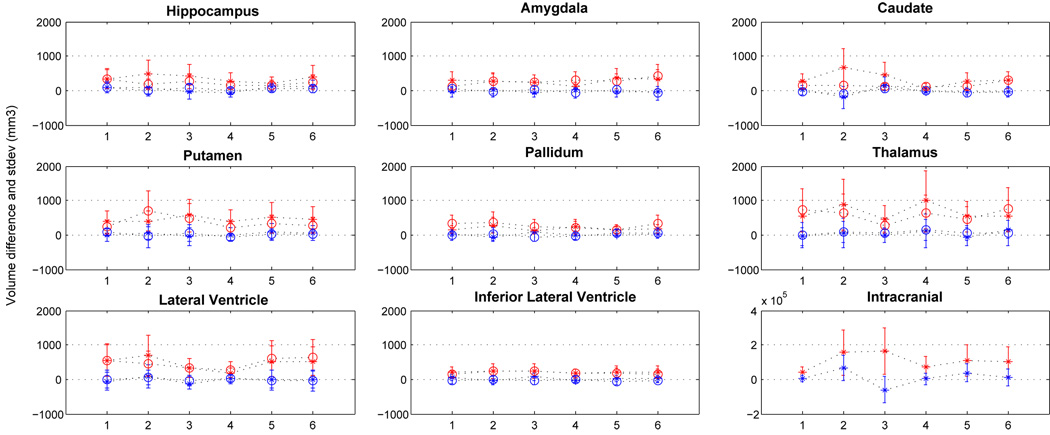
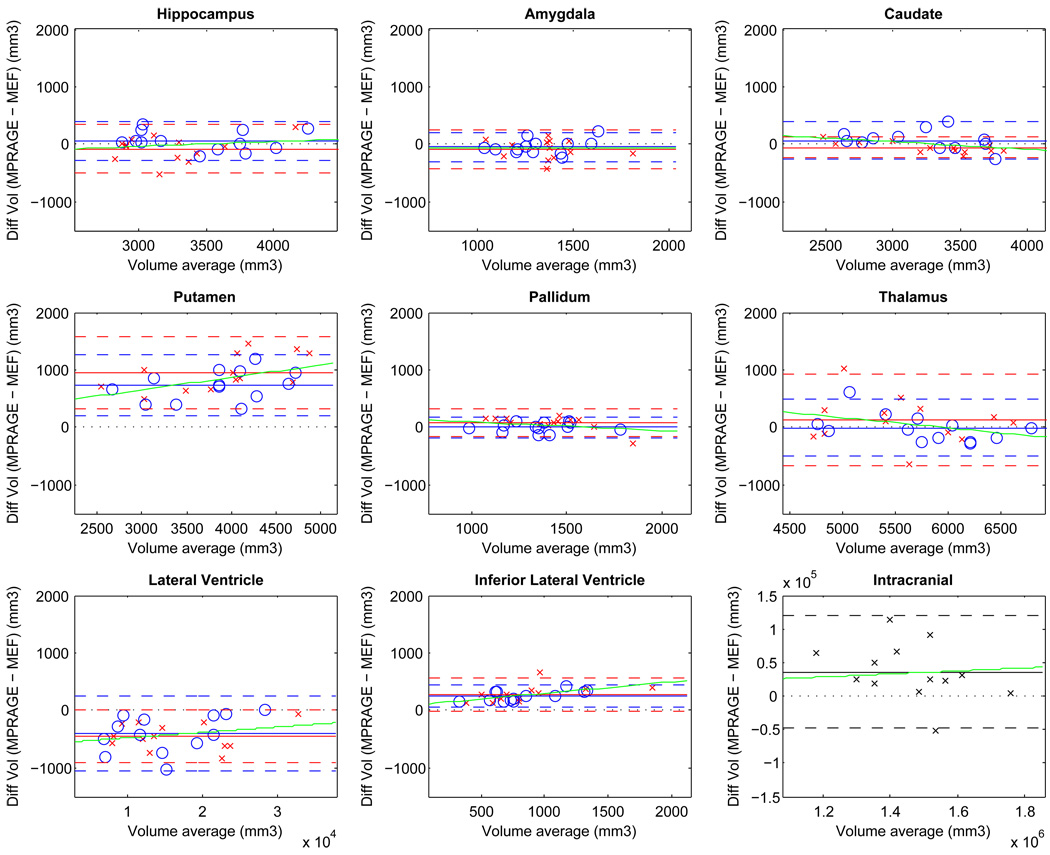
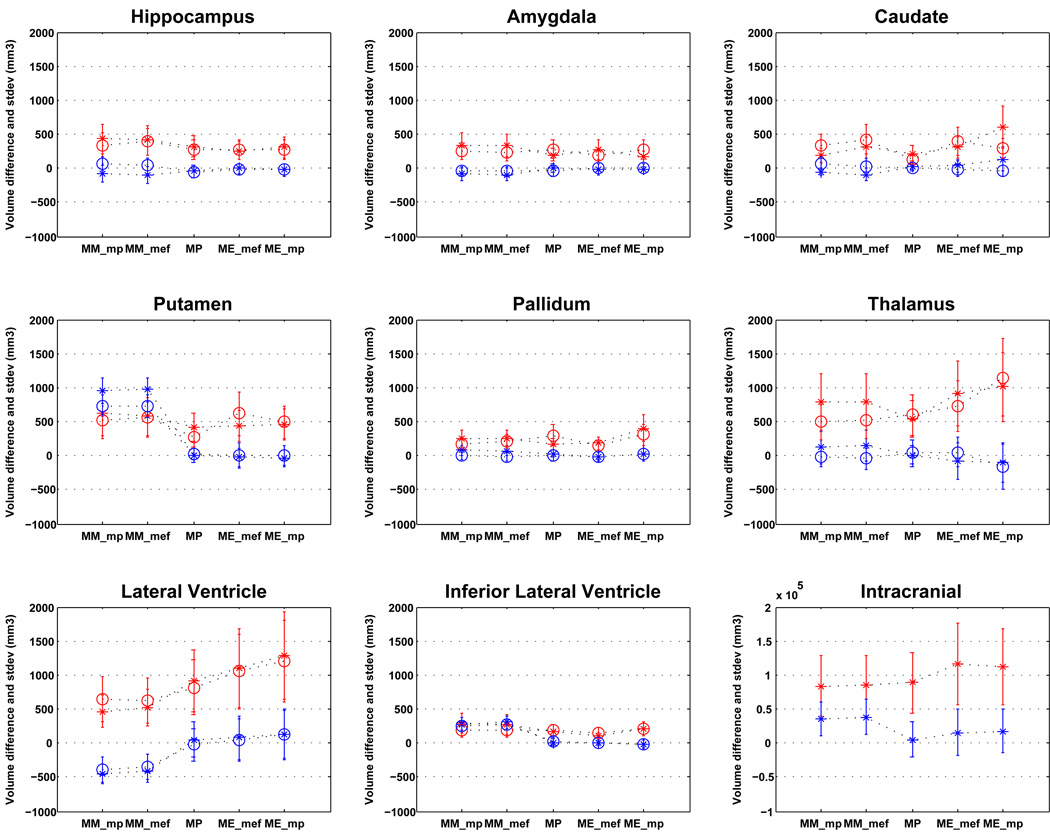
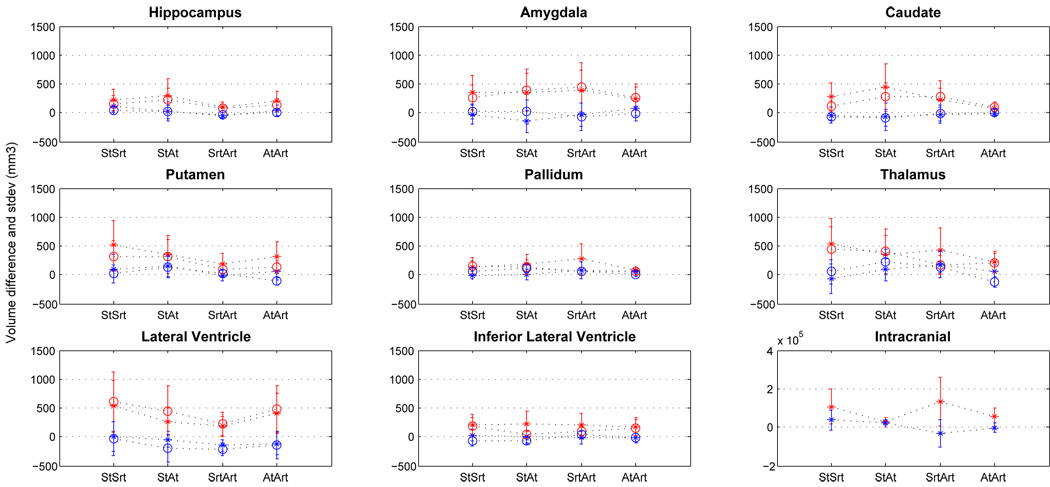
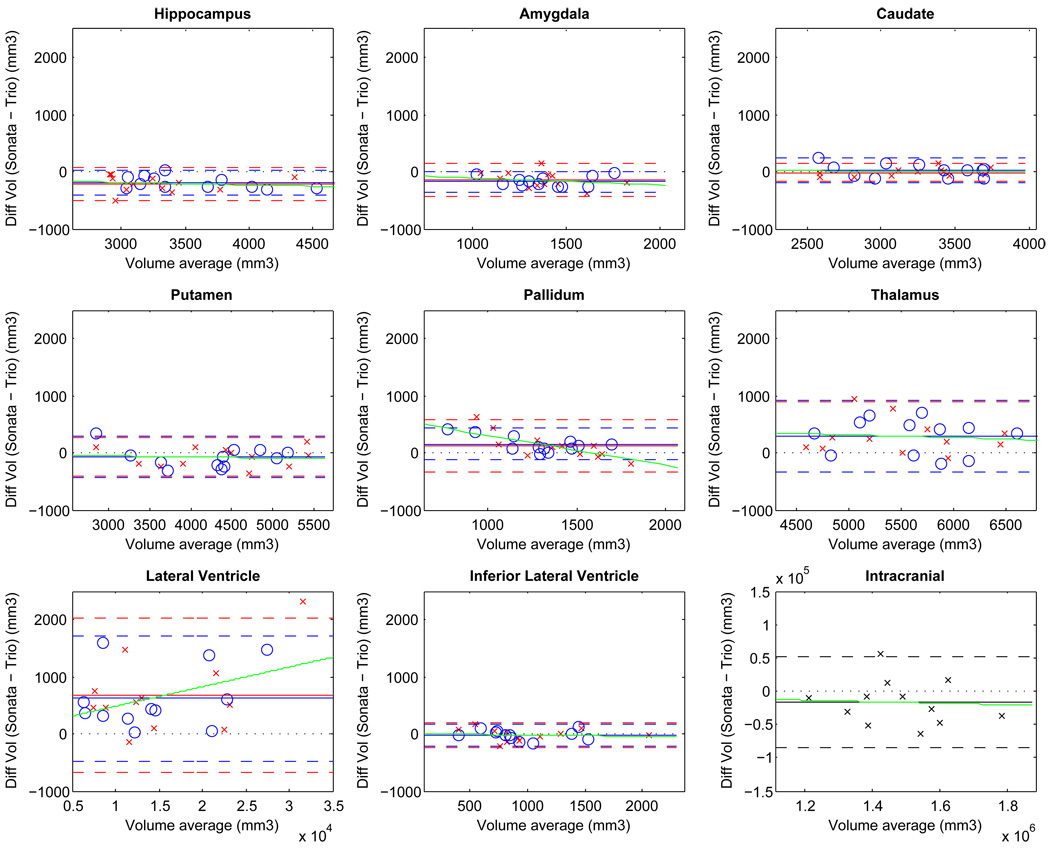
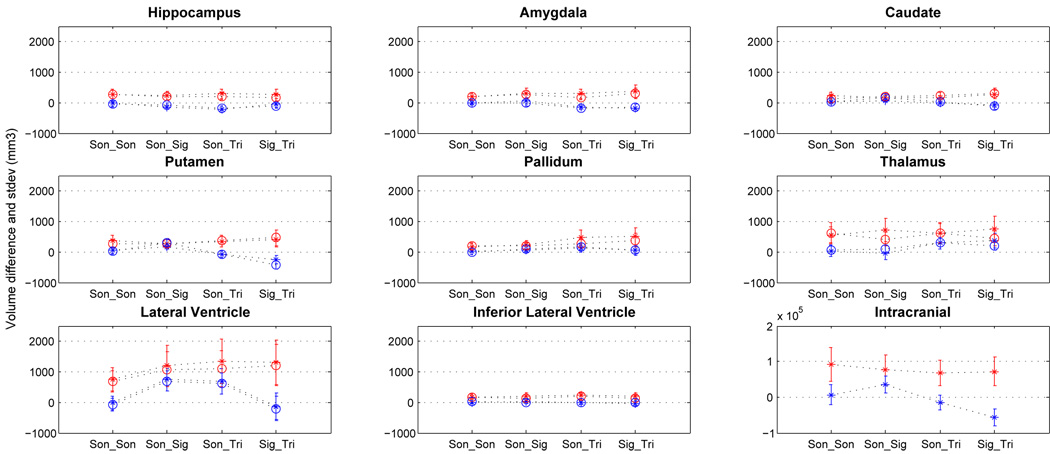
Automated MRI-derived measurements of in-vivo human brain volumes provide novel insights into normal and abnormal neuroanatomy, but little is known about measurement reliability. Here we assess the impact of image acquisition variables (scan session, MRI sequence, scanner upgrade, vendor and field strengths), FreeSurfer segmentation pre-processing variables (image averaging, B1 field inhomogeneity correction) and segmentation analysis variables (probabilistic atlas) on resultant image segmentation volumes from older (n=15, mean age 69.5) and younger (both n=5, mean ages 34 and 36.5) healthy subjects. The variability between hippocampal, thalamic, caudate, putamen, lateral ventricular and total intracranial volume measures across sessions on the same scanner on different days is less than 4.3% for the older group and less than 2.3% for the younger group. Within-scanner measurements are remarkably reliable across scan sessions, being minimally affected by averaging of multiple acquisitions, B1 correction, acquisition sequence (MPRAGE vs. multi-echo-FLASH), major scanner upgrades (Sonata-Avanto, Trio-TrioTIM), and segmentation atlas (MPRAGE or multi-echo-FLASH). Volume measurements across platforms (Siemens Sonata vs. GE Signa) and field strengths (1.5 T vs. 3 T) result in a volume difference bias but with a comparable variance as that measured within-scanner, implying that multi-site studies may not necessarily require a much larger sample to detect a specific effect. These results suggest that volumes derived from automated segmentation of T1-weighted structural images are reliable measures within the same scanner platform, even after upgrades; however, combining data across platform and across field-strength introduces a bias that should be considered in the design of multi-site studies, such as clinical drug trials. The results derived from the young groups (scanner upgrade effects and B1 inhomogeneity correction effects) should be considered as preliminary and in need for further validation with a larger dataset.


Figures

Figure 1
Figure 1
Sample color-coded subcortical segmentation results (right hemisphere only): hippocampus (yellow), thalamus (green), caudate (light blue), putamen (pink), pallidum (dark blue) and amygdala (turquoise). Top: Freesurfer derived subcortical labels, from a two-averaged MPRAGE in axial (left), coronal (center) and sagittal (right) views. Bottom: 3D surface models created with 3D Slicer derived from the Freesurfer subcortical segmentations.
Figure 2
Figure 2
Within-session repeatability of volumes: Bland-Altman plots showing volume difference vs. volume mean (single MPRAGE acquisitions, Siemens Sonata, group of older subjects, n=15). For each brain hemisphere (left: red crosses, right: blue circles) the mean volume difference (solid horizontal line) and the limits of agreement (±2 standard deviations, interrupted horizontal lines) are shown. For reference, zero volume difference is shown as a black dotted line.
Figure 3
Figure 3
Effects of scan session (within session and across sessions) and data averaging on volume repeatability in the older group (MPRAGE acquisitions, Siemens Sonata, n=15). Bland-Altman results of mean volume difference (blue) and limits of agreement (red) for both brain hemispheres (left: crosses, right: circles) are shown with their respective 95% confidence intervals for the various repeatability conditions: test session, (1: variability across the two acquisitions); retest session (2: variability across the two acquisitions); single acquisition data mixed from the test-retest sessions (3: first test with first retest acquisitions; 4: first test with second retest acquisitions; 5: second test with first retest acquisition and 6: second test with second retest acquisitions); and average scans from each session (7: two test scans averaged with two retest scans averaged). Black dotted lines connect the volume differences and the limits of agreement across conditions.
Figure 4
Figure 4
Effects of scan session (within, across), data averaging and B1 inhomogeneity corrections in volume reproducibility in the younger group (MPRAGE acquisitions, Siemens Sonata, n=5). Bland-Altman results of mean volume difference (blue) and limits of agreement (red) for both brain hemispheres (left: crosses, right: circles) are shown with their respective 95% confidence intervals for the various repeatability conditions: test session, (1: variability across the two acquisitions); retest session (2: variability across the two acquisitions); single acquisition data mixed from the test-retest sessions (3: first test with first retest acquisitions; 4: second test with second retest acquisitions); average scans from each session (5: two test scans averaged with two retest scans averaged) and average B1 corrected scans (6: two B1 corrected test scans averaged with two B1 corrected retest scans averaged).
Figure 5
Figure 5
Within-session agreement between volume estimates derived from MPRAGE and MEF acquisitions. Bland-Altman plots showing volume difference vs. volume mean (Siemens Sonata, group of older subjects, n=15). For each brain hemisphere (left: red crosses, right: blue circles) the mean volume difference (solid horizontal line) and the limits of agreement (±2 standard deviations, interrupted horizontal lines) are shown. For reference, zero volume difference is shown as a black dotted line. Green lines show the linear regression fits for each brain structure (grouping data from both hemispheres). See text for the regression slopes.
Figure 6
Figure 6
Effects of acquisition sequence and segmentation atlas on volume reproducibility. Within-session agreement and across session test-retest repeatability of volumes derived from MPRAGE (MP) and multi-echo FLASH (MEF_mef: MEF atlas, MEF_mp: MPRAGE atlas). Bland-Altman results of mean volume difference (blue) and limits of agreement (red) for both brain hemispheres (left: crosses, right: circles) are shown with their respective 95% confidence intervals for the various repeatability conditions: within session agreement (MM_mp: MP vs. MEF_mp, MM_mef: MP vs. MEF_mef); across session test-retest reproducibility (MP, MEF_mef and MEF_mp). Black dotted lines connect the volume differences and the limits of agreement across conditions.
Figure 7
Figure 7
Effect of MRI system upgrade on volume reproducibility (within-session averaged MPRAGE, Siemens Sonata-Avanto, 1.5T, young group, n=5). Bland-Altman results of mean volume difference (blue) and limits of agreement (red) for both brain hemispheres (left: crosses, right: circles) are shown with their respective 95% confidence intervals for the various repeatability conditions: before upgrade (Sonata test-retest: StSrt), across upgrade (Sonata test vs. Avanto test: StAt, Sonata retest vs. Avanto retest: SrtArt) and post upgrade (Avanto test-retest: AtArt). Black dotted lines connect the volume differences and the limits of agreement across conditions.
Figure 8
Figure 8
Agreement of subcortical volume estimates from two scanners from the same vendor with different field strengths: Siemens Sonata and Siemens Trio. The Bland-Altman plots show volume difference vs. volume mean (Sonata - Trio, from each scanner volumes are segmented from a two-averaged MPRAGE acquisition, group of older subjects, n=15). For each brain hemisphere (left: red crosses, right: blue circles) the mean volume difference (solid horizontal line) and the limits of agreement (±2 standard deviations, interrupted horizontal lines) are shown. For reference, zero volume difference is shown as a black dotted line. Green lines show the linear regression fits for each brain structure (grouping data from both hemispheres). See text for the regression slopes.
Figure 9
Figure 9
Effects of scanner vendor and field strength on volume reproducibility (across-session, each session with a two-averaged MPRAGE, older group, n=15). Bland-Altman results of mean volume difference (blue) and limits of agreement (red) for both brain hemispheres (left: crosses, right: circles) are shown with their respective 95% confidence intervals for the following conditions: same MRI system (Sonata-Sonata, Son_Son), same field different vendor (Sonata-Signa, Son_Sig), same vendor different field (Sonata-Trio, Son_Tri) and different vendor and field (Signa-Trio, Sig_Trio). Black dotted lines connect the volume differences and the limits of agreement across conditions.

Similar articles

Cited by

References

    1. Alecci M, Zhang Y, Brady JM, Jezzard P, Smith S. Image-based evaluation of a-priori B1 field correction and its effect on MRI tissue segmentation. Proc. Int. Soc. of Magnetic Resonance in Medicine. 2000:109.
    1. Alemán-Gómez Y, Melie-García L, Valdés-Hernandez P. IBASPM: Toolbox for automatic parcellation of brain structures; Human Brain Mapping, 12th Annual Meeting; Florence, Italy. 2007.
    1. Anstey KJ, Maller JJ. The role of volumetric MRI in understanding mild cognitive impairment and similar classifications. Aging Ment Health. 2003;7:238–250. - PubMed
    1. Ashburner J, Friston KJ. Voxel-based morphometry - The methods. NeuroImage. 2000;11:805–821. - PubMed
    1. Barnes J, Lewis EB, Scahill RI, Bartlett JW, Frost C, Schott JM, Rossor MN, Fox NC. Automated measurement of hippocampal atrophy using fluidregistered serial MRI in AD and controls. J. Comput. Assist. Tomogr. 2007;31:581–587. - PubMed

Publication types