

Characterization of white matter degeneration in elderly subjects by magnetic resonance diffusion and FLAIR imaging correlation
- PMID: 19233296
- PMCID: PMC2720418
- DOI: 10.1016/j.neuroimage.2009.02.004
Characterization of white matter degeneration in elderly subjects by magnetic resonance diffusion and FLAIR imaging correlation
Abstract
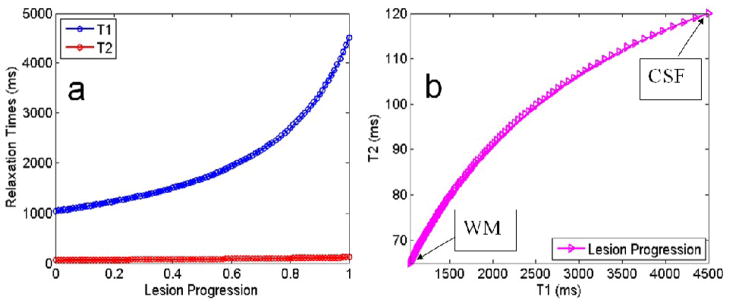
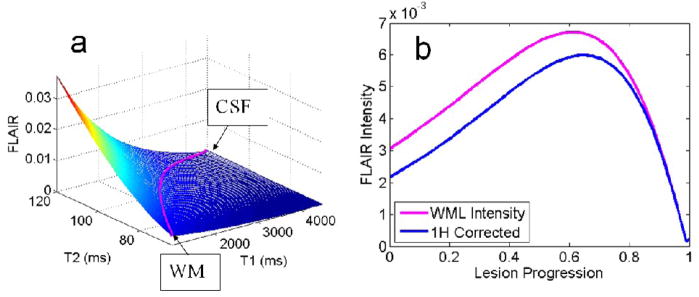
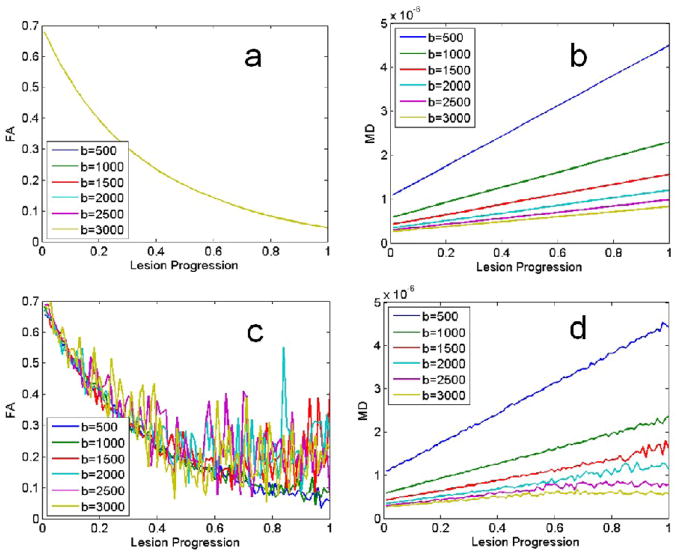
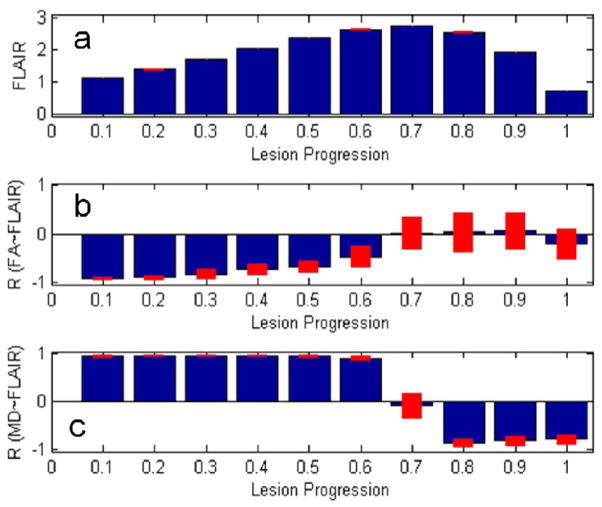
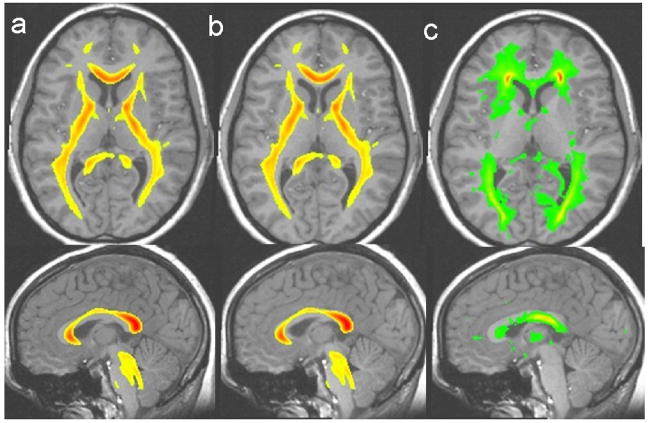
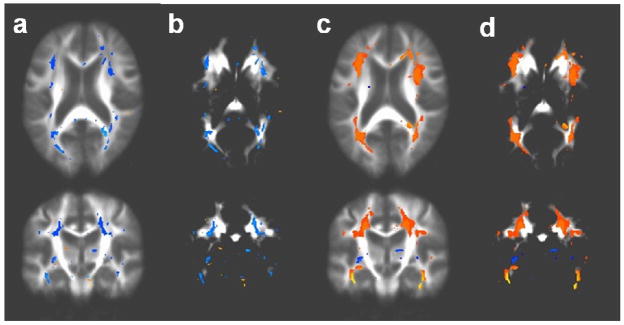
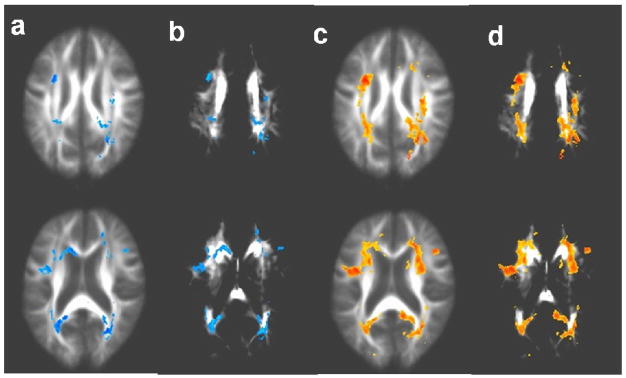
Fluid attenuated inversion recovery (FLAIR) and diffusion tensor imaging (DTI) techniques have been widely used to evaluate white matter (WM) alterations associated with aging, dementia and cerebral vascular disease. The relationship between FLAIR detected WM lesions (WML) and DTI detected WM integrity changes, however, remains unclear. To investigate this association, voxelwise correlations between 4 Tesla DTI and FLAIR images from elderly subjects were performed by relating WML volume and intensity in FLAIR to fractional anisotropy (FA) and mean diffusivity (MD) in DTI. Significant DTI-FLAIR correlations were found in regions overlapping with the WML of moderate intensities in FLAIR. No significant correlations were detected in periventricular regions where the FLAIR intensities are particularly high. The findings are consistent with a transitional model for WM degeneration from normal WM to cerebrospinal fluid (CSF). The results show that the correlation between DTI and FLAIR disappears when the FLAIR intensity of WML reaches its maximum at a certain lesion severity, and that the correlations may remerge with reversed signs when the lesion severity is further increased. These results suggest that the different stages of WM degeneration in elderly subjects can be better characterized by regional DTI-FLAIR correlations than single modality alone.
Figures
Similar articles
-
Changes in normal-appearing white matter precede development of white matter lesions.Stroke. 2013 Apr;44(4):1037-42. doi: 10.1161/STROKEAHA.112.680223. Epub 2013 Feb 21. Stroke. 2013. PMID: 23429507
-
The role of diffusion tensor imaging and fractional anisotropy in the evaluation of patients with idiopathic normal pressure hydrocephalus: a literature review.Neurosurg Focus. 2016 Sep;41(3):E12. doi: 10.3171/2016.6.FOCUS16192. Neurosurg Focus. 2016. PMID: 27581308 Review.
-
Diffusion tensor imaging and cognition in cerebral small vessel disease: the RUN DMC study.Biochim Biophys Acta. 2012 Mar;1822(3):401-7. doi: 10.1016/j.bbadis.2011.04.008. Epub 2011 Apr 29. Biochim Biophys Acta. 2012. PMID: 21549191
-
A multimodal MRI approach to identify and characterize microstructural brain changes in neuropsychiatric systemic lupus erythematosus.Neuroimage Clin. 2015 May 16;8:337-44. doi: 10.1016/j.nicl.2015.05.002. eCollection 2015. Neuroimage Clin. 2015. PMID: 26106559 Free PMC article.
-
The role of diffusion tensor imaging in the evaluation of ischemic brain injury - a review.NMR Biomed. 2002 Nov-Dec;15(7-8):561-9. doi: 10.1002/nbm.786. NMR Biomed. 2002. PMID: 12489102 Review.
Cited by
-
White matter hyperintensity penumbra.Stroke. 2011 Jul;42(7):1917-22. doi: 10.1161/STROKEAHA.110.609768. Epub 2011 Jun 2. Stroke. 2011. PMID: 21636811 Free PMC article.
-
Associations between white matter hyperintensities and β amyloid on integrity of projection, association, and limbic fiber tracts measured with diffusion tensor MRI.PLoS One. 2013 Jun 6;8(6):e65175. doi: 10.1371/journal.pone.0065175. Print 2013. PLoS One. 2013. PMID: 23762308 Free PMC article.
-
Improved DTI registration allows voxel-based analysis that outperforms tract-based spatial statistics.Neuroimage. 2014 Jul 1;94:65-78. doi: 10.1016/j.neuroimage.2014.03.026. Epub 2014 Mar 18. Neuroimage. 2014. PMID: 24650605 Free PMC article.
-
Joint assessment of structural, perfusion, and diffusion MRI in Alzheimer's disease and frontotemporal dementia.Int J Alzheimers Dis. 2011;2011:546871. doi: 10.4061/2011/546871. Epub 2011 Jun 27. Int J Alzheimers Dis. 2011. PMID: 21760989 Free PMC article.
-
Advanced BrainAGE in older adults with type 2 diabetes mellitus.Front Aging Neurosci. 2013 Dec 17;5:90. doi: 10.3389/fnagi.2013.00090. eCollection 2013. Front Aging Neurosci. 2013. PMID: 24381557 Free PMC article.
References
-
- Alexander AL, Hansan KM, Kindlmann G, Parker DL, Tsuruda JS. A Geometric analysis of diffusion tensor measurements of the human brain. Magn Reson Med. 2000;44:283–291. - PubMed
-
- Ahn KH, Lyoo IK, Lee HK, Song IC, Oh JS, Hwang J, Kwon J, Kim MJ, Kim M, Renshaw PF. White matter hyperintensities in subjects with bipolar disorder. Psychiatry Clin Neurosci. 2004;58(5):516–521. - PubMed
-
- Basser PJ, Pierpaoli C. Microstructural and physiological features of tissues elucidated by quantitative-diffusion-tensor MRI. J Magn Reson Series B. 1996;111:209–219. - PubMed
-
- Bodammer N, Kaufmann J, Kanowski M, Tempelmann C. Eddy current correction in diffusion-weighted imaging using pairs of images acquired with opposite diffusion gradient polarity. Magn Reson Med. 2004;51(1):188–193. - PubMed
Publication types
MeSH terms
Grants and funding
LinkOut - more resources
Full Text Sources
Medical
