. 2009 Jun;153(2):213-21.
doi: 10.1016/j.cbpa.2009.02.016. Epub 2009 Feb 20.

Physiological oxidative stress after arousal from hibernation in Arctic ground squirrel

Affiliations

Physiological oxidative stress after arousal from hibernation in Arctic ground squirrel

Adrienne L Orr et al. Comp Biochem Physiol A Mol Integr Physiol. 2009 Jun.

Abstract

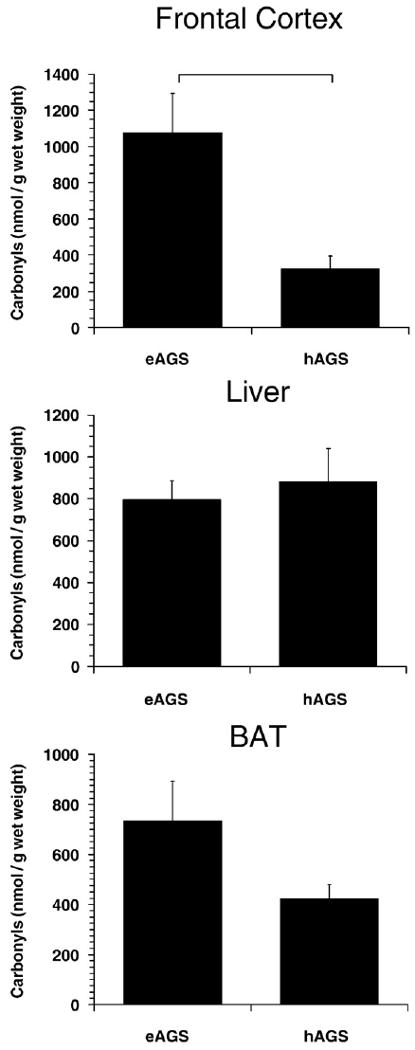
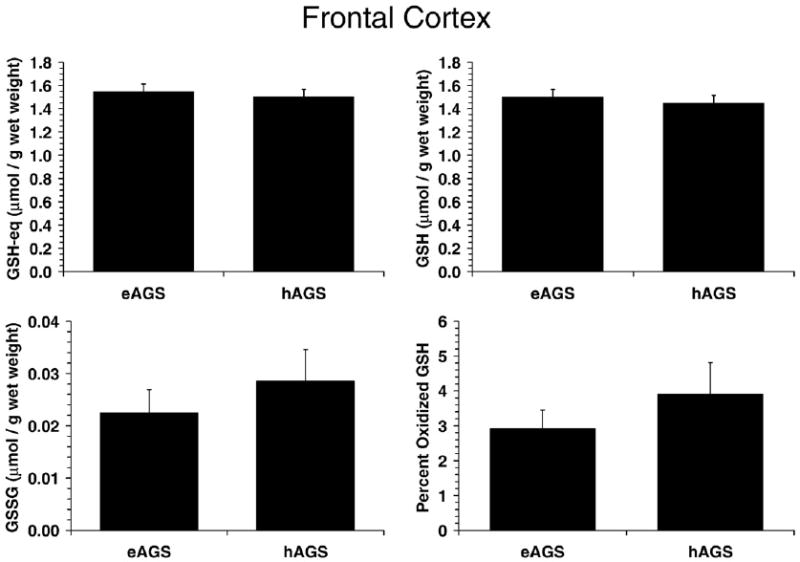
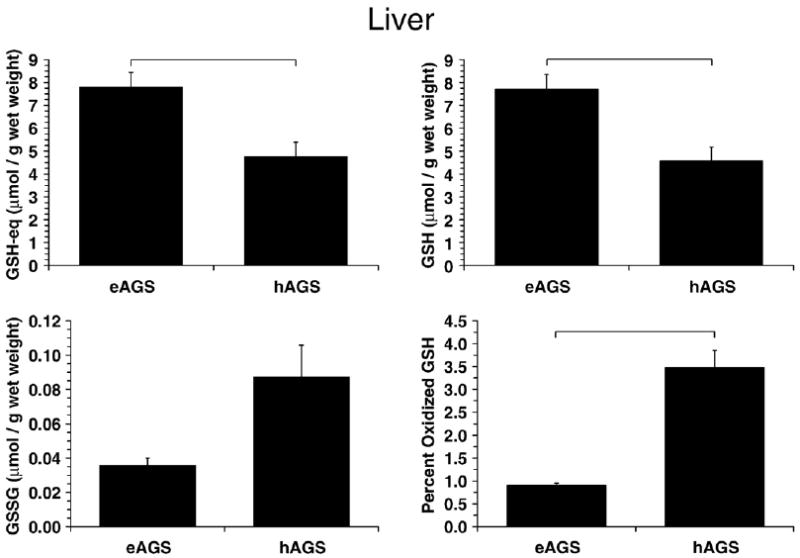
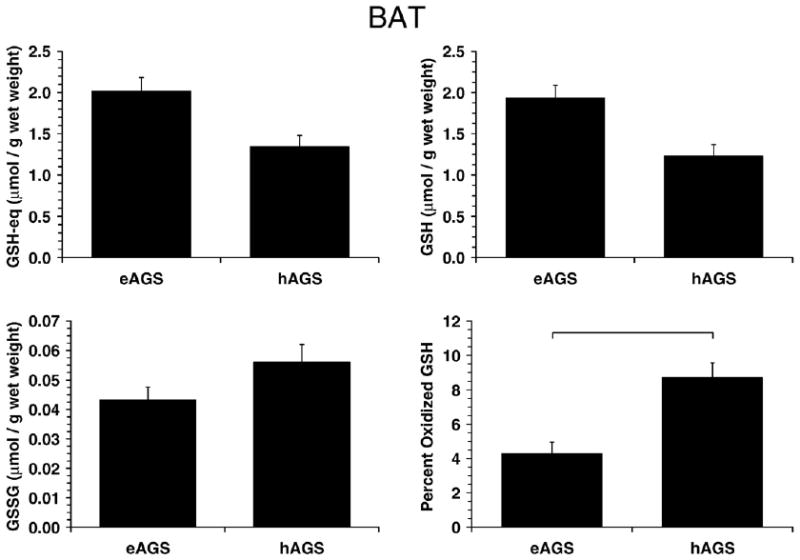
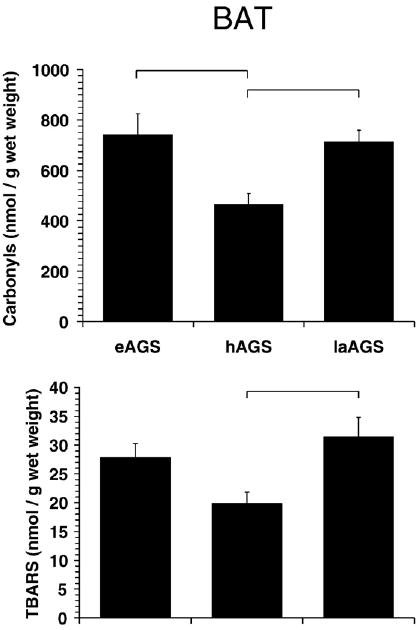
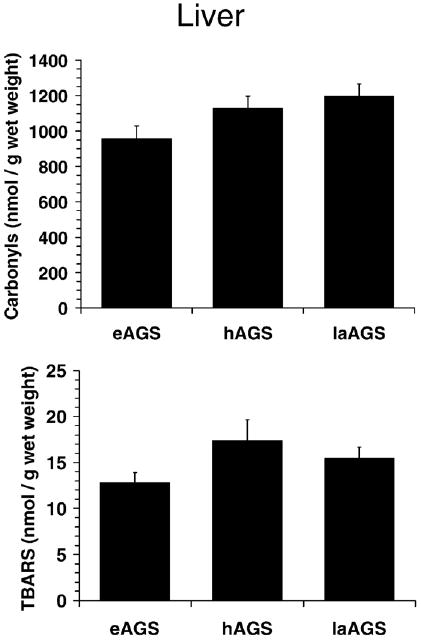
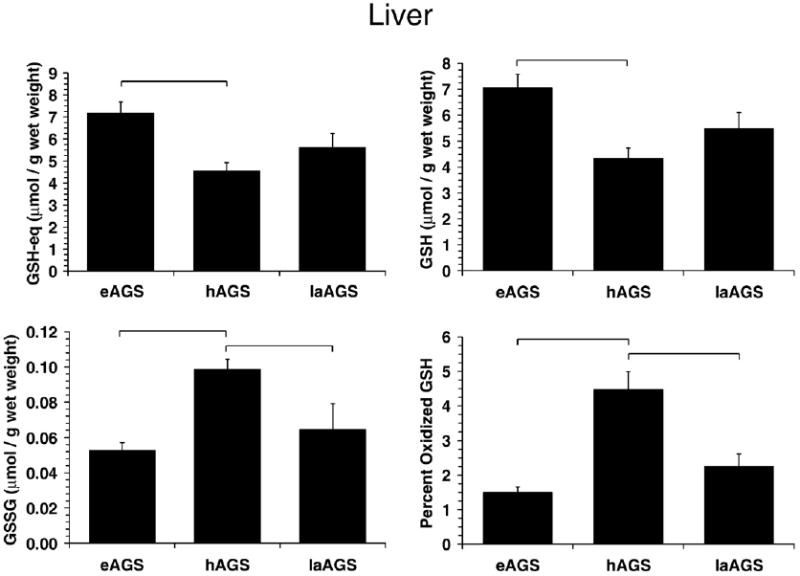
Hibernation in Arctic ground squirrels (AGS), Spermophilus parryii, is characterized by a profound decrease in oxygen consumption and metabolic demand during torpor that is punctuated by periodic rewarming episodes, during which oxygen consumption increases dramatically. The extreme physiology of torpor or the surge in oxygen consumption during arousal may increase production of reactive oxygen species, making hibernation an injurious process for AGS. To determine if AGS tissues experience cellular stress during rewarming, we measured carbonyl proteins, lipid peroxide end products and percent oxidized glutathione in brown adipose tissue (BAT) and liver of torpid, hibernating (hAGS), late arousal (laAGS), and cold-adapted, euthermic AGS (eAGS). In BAT carbonyl proteins and lipid peroxide end products were higher in eAGS and laAGS than in hAGS. By contrast, in liver, no significant difference in carbonyl proteins was observed. In another group of animals, comparison of carbonyl proteins and percent oxidized glutathione in frontal cortex, liver, and BAT of eAGS and hAGS showed no evidence of oxidative stress associated with torpor. These results indicate that increased thermogenesis associated with arousal AGS results in tissue specific oxidative stress in BAT but not in liver. Moreover, torpor per se is largely devoid of oxidative stress, likely due to suppression of oxidative metabolism.


Figures

Fig. 1
Fig. 1
Carbonyl protein levels in frontal cortex, liver and BAT. In frontal cortex, carbonyl protein levels are significantly lower during hibernation. Horizontal bar indicates significant difference between groups (p<0.01, SNK, n=6 hAGS, n=5 eAGS). Rat data is described below, for comparison with a familiar species, but not shown to avoid over-interpretation of cross-species comparisons. Levels of CP in frontal cortex of rat were 797±132 nmol/g wet mass (p<0.05, SNK compared to hAGS, n=4 rats). Levels of CP in BAT from rat were 107±29 nmol/g wet mass (p<0.01, SNK compared to eAGS, n=4 rats).
Fig. 2
Fig. 2
GSH parameters in brain. GSH parameters were not different in brain of hAGS and eAGS (n=6/group) and were comparable to values observed in rat (n=4 rats). Values (mean±SEM) for rat for GSH-eq, GSH, GSSG and percent oxidized GSH were: 1.7±0.14, 1.6±0.15, 0.034±0.011 (μmol/g wet mass) and 4.2±1.3% respectively.
Fig. 3
Fig. 3
GSH parameters in liver. Percent oxidized GSH was higher in hAGS relative to eAGS (p<0.05, Dunns, n=6) while GSH-eq and GSH was lower in hAGS relative to eAGS (p<0.005, SNK, n=6) as indicated by horizontal bars. For comparison with a familiar species GSH-eq in rat (8.4±0.5 μmol/g wet mass, n=4) was higher than in hAGS (p<0.01, SNK, n=4–6). GSH in rat (8.1±0.5 μmol/g wet mass, n=4) was similar to eAGS but higher than in hAGS (p<0.01, SNK, n=4–6). GSSG was higher in eAGS than in rat (0.13±0.01 μmol/g wet mass, p<0.05, Dunns, n=4–6).
Fig. 4
Fig. 4
GSH parameters in BAT. Percent oxidized GSH in BAT was higher in hAGS relative to eAGS (p<0.001, SNK, n=6) as indicated by horizontal bar. For reference to a familiar species, GSH-eq was 3 fold higher in eAGS than in rat (0.71±0.2 μmol/g wet mass, n=4, p<0.01, Dunns); GSH was higher in eAGS than in rat (0.70±0.2 μmol/g wet mass, n=4, p<0.05, Dunns); and, GSSG was 10 fold higher in hAGS and eAGS than in rat (0.003±0.002 μmol/g wet mass, n=4) although the difference between rat and AGS was statistically significant only with comparison to eAGS (p<0.05, Dunns).
Fig. 5
Fig. 5
Oxidative stress is highest in BAT after arousal and during euthermy. Levels of carbonyl proteins were less in hAGS compared to laAGS (p<0.02, SNK, n=5) and compared to eAGS (p<0.02, SNK, n=5). Levels of TBARS were also less in hAGS compared to laAGS (p<0.05, Dunn's method, n=4–5) as indicated by horizontal bars. Data from animals treated with AO prior to arousal are described below, but not shown because AO did not affect any of the parameters measured. Level of protein carbonyls in BAT from animals treated with AO prior to arousal was 608±52 nmol/g wet mass and was not significantly different from late arousal (laAGS) animals treated with saline prior to arousal (p>0.30, t-test, n=5). Similarly, level of TBARS in animals treated with AO prior to arousal was 37±7.1 nmol/g wet mass and was not significantly different from laAGS treated with saline prior to arousal (p>0.5, t-test, n=5).
Fig. 6
Fig. 6
No evidence of oxidative stress was observed in liver after arousal. Level of protein carbonyls in liver from animals treated with AO prior to arousal was 1060± 73 nmol/g wet mass and was not significantly different from late arousal (laAGS) animals treated with saline prior to arousal (p>0.20, t-test, n=5). Similarly, levels of TBARS in animals treated with AO prior to arousal was 14.4±2.1 nmol/g wet mass and was not significantly different from laAGS (p>0.68, t-test, n=5).
Fig. 7
Fig. 7
Alterations in GSH metabolism in liver during arousal results in an increase in percent oxidized GSH in hAGS relative to eAGS (p<0.001, SNK, n=5). A decrease in GSSG was also observed following arousal where GSSG was greater in hAGS than in laAGS (p<0.05, SNK, n=5). Horizontal bars indicates significant difference (p<0.05) between groups. There was no significant difference between animals treated with ascorbate oxidase or saline (laAGS) prior to arousal in any of the parameters measured (p>0.60, n=5). Values for AO treated animals are as follows: GSH-eq 5.50±0.49 μmol/g wet mass; GSH 5.37±0.49 μmol/g wet mass; GSSG 0.0674±0.011 μmol/g wet mass; percent oxidized GSH was 2.48±0.40.

Similar articles

Cited by

References

    1. Bickler PE, Buck LT. Hypoxia tolerance in reptiles, amphibians, and fishes: life with variable oxygen availability. Annu Rev Physiol. 2007;69:145–170. - PubMed
    1. Blagojevic D, Buzadzic B, Korac B, Saicic ZS, Radojicic R, Spasic MB, Petrovic VM. Seasonal changes in the antioxidative defense in ground squirrels (Citellus citellus): possible role of GSH-Px. J Environ Pathol Toxicol Oncol. 1998;17:241–250. - PubMed
    1. Boyer BB, Barnes BM, Lowell BB, Grujic D. Differential regulation of uncoupling protein gene homologues in multiple tissues of hibernating ground squirrels. Am J Physiol. 1998;275:R1232–1238. - PubMed
    1. Brand MD, Esteves TC. Physiological functions of the mitochondrial uncoupling proteins UCP2 and UCP3. Cell Metab. 2005;2:85–93. - PubMed
    1. Buzadzic B, Spasic M, Saicic ZS, Radojicic R, Petrovic VM, Halliwell B. Antioxidant defenses in the ground squirrel Citellus citellus. 2. The effect of hibernation. Free Radic Biol Med. 1990;9:407–413. - PubMed

Publication types

LinkOut - more resources