. 2009 Feb;21(2):622-41.
doi: 10.1105/tpc.108.061994. Epub 2009 Feb 20.

Drought stress-induced Rma1H1, a RING membrane-anchor E3 ubiquitin ligase homolog, regulates aquaporin levels via ubiquitination in transgenic Arabidopsis plants

Affiliations

Drought stress-induced Rma1H1, a RING membrane-anchor E3 ubiquitin ligase homolog, regulates aquaporin levels via ubiquitination in transgenic Arabidopsis plants

Hyun Kyung Lee et al. Plant Cell. 2009 Feb.

Abstract

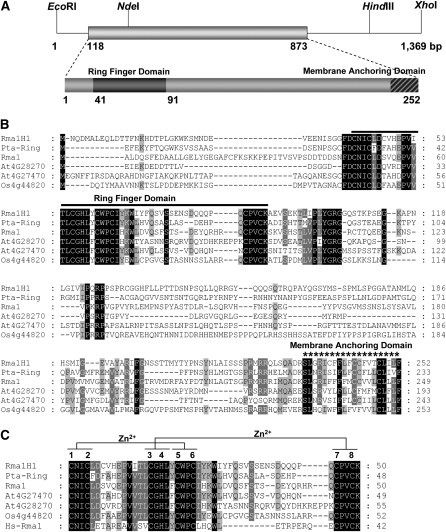
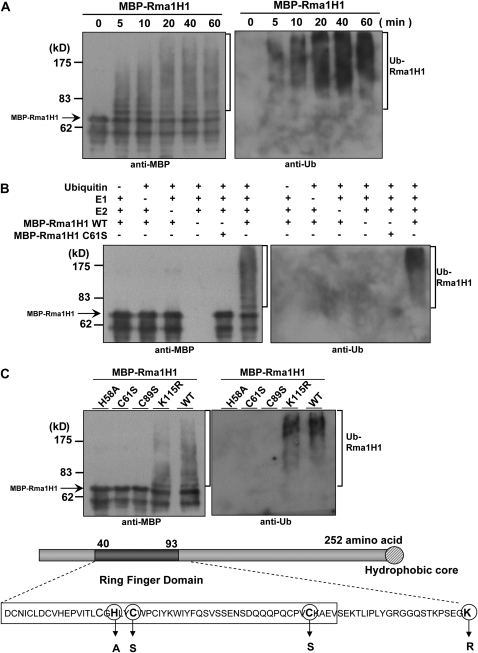
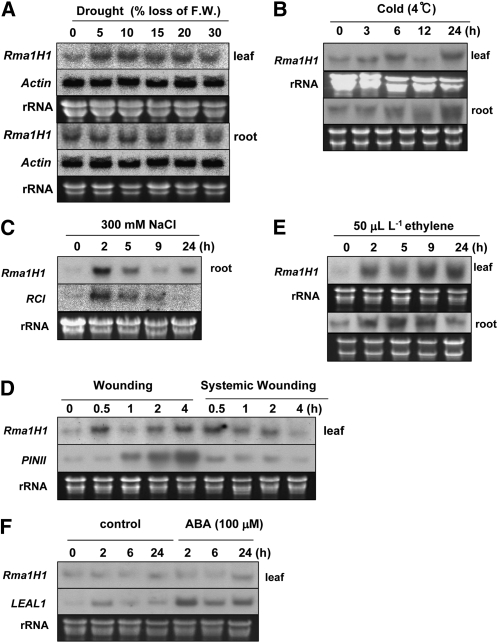
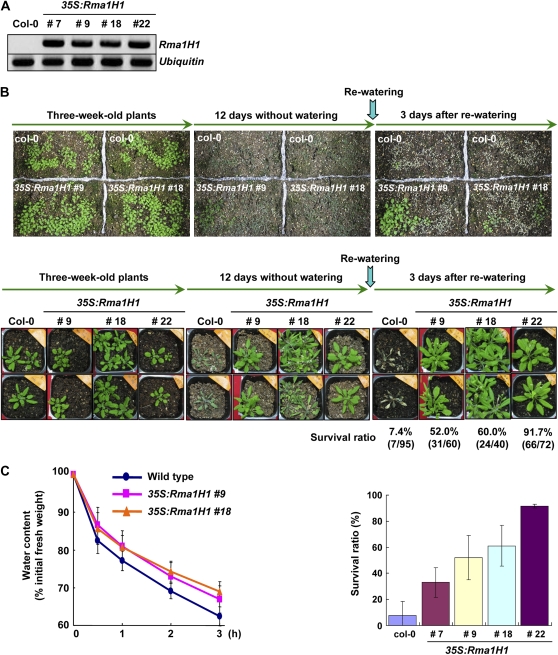
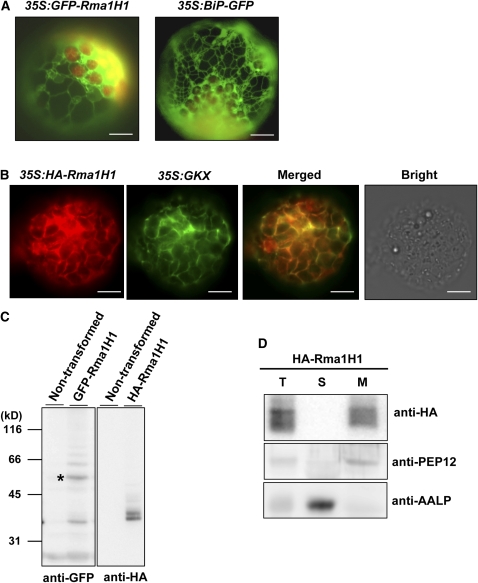
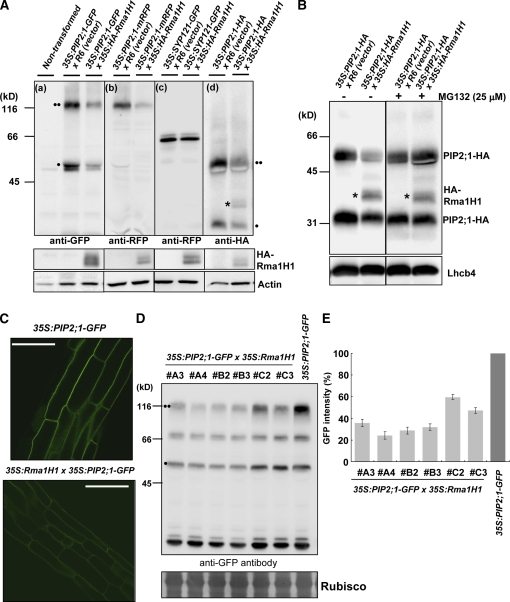
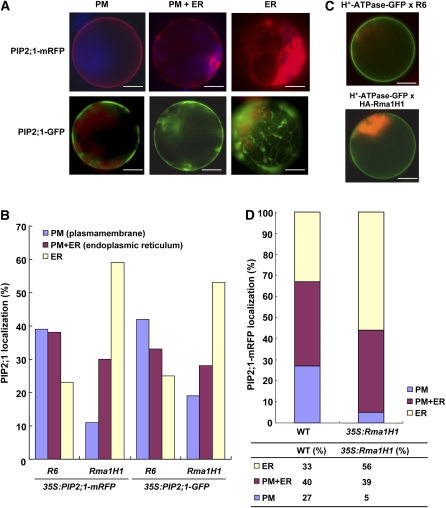
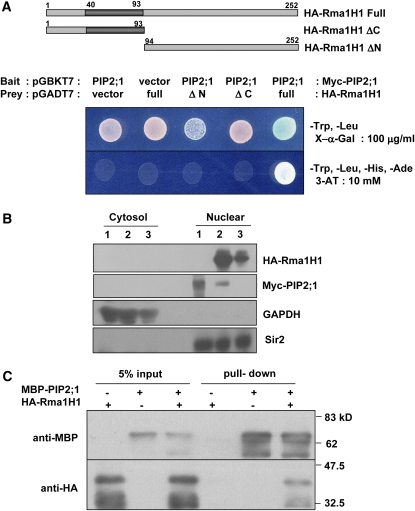
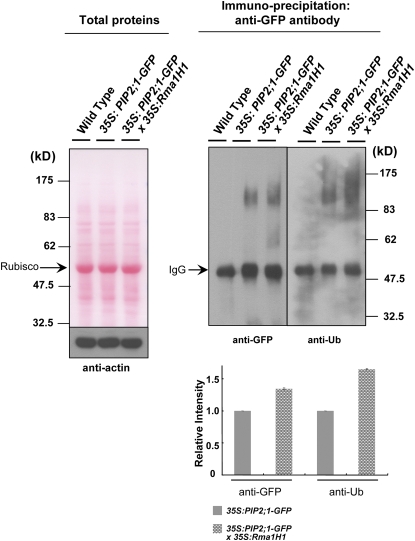
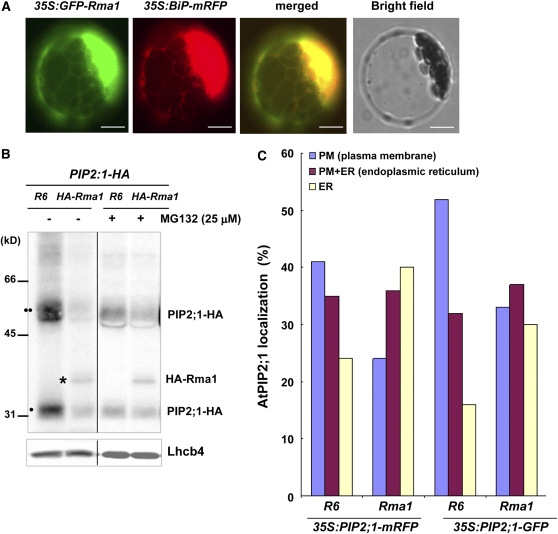
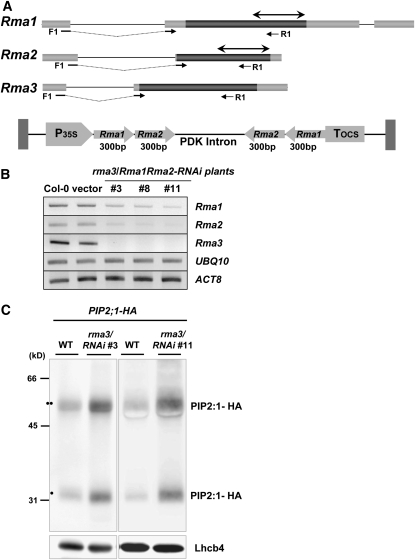
Ubiquitination is involved in a variety of biological processes, but the exact role of ubiquitination in abiotic responses is not clearly understood in higher plants. Here, we investigated Rma1H1, a hot pepper (Capsicum annuum) homolog of a human RING membrane-anchor 1 E3 ubiquitin (Ub) ligase. Bacterially expressed Rma1H1 displayed E3 Ub ligase activity in vitro. Rma1H1 was rapidly induced by various abiotic stresses, including dehydration, and its overexpression in transgenic Arabidopsis thaliana plants conferred strongly enhanced tolerance to drought stress. Colocalization experiments with marker proteins revealed that Rma1H1 resides in the endoplasmic reticulum (ER) membrane. Overexpression of Rma1H1 in Arabidopsis inhibited trafficking of an aquaporin isoform PIP2;1 from the ER to the plasma membrane and reduced PIP2;1 levels in protoplasts and transgenic plants. This Rma1H1-induced reduction of PIP2;1 was inhibited by MG132, an inhibitor of the 26S proteasome. Furthermore, Rma1H1 interacted with PIP2;1 in vitro and ubiquitinated it in vivo. Similar to Rma1H1, Rma1, an Arabidopsis homolog of Rma1H1, localized to the ER, and its overexpression reduced the PIP2;1 protein level and inhibited trafficking of PIP2;1 from the ER to the plasma membrane in protoplasts. In addition, reduced expression of Rma homologs resulted in the increased level of PIP2;1 in protoplasts. We propose that Rma1H1 and Rma1 play a critical role in the downregulation of plasma membrane aquaporin levels by inhibiting aquaporin trafficking to the plasma membrane and subsequent proteasomal degradation as a response to dehydration in transgenic Arabidopsis plants.


Figures

Figure 1.
Figure 1.
Sequence Analysis of Hot Pepper Rma1H1. (A) Restriction enzyme map analysis and schematic structure of the hot pepper Rma1H1 cDNA clone and predicted Rma1H1 protein. Solid bar represents the coding region. Solid lines depict 5′- and 3′-untranslated regions. Dark bar indicates N-terminal RING motif, while hatched bar shows C-terminal membrane anchoring domain. (B) Comparison of the derived amino acid sequence of hot pepper Rma1H1 with those of the poplar Pta-Ring protein, Arabidopsis RING membrane anchor 1 (Rma1), Rma2 (At4g28270), and Rma3 (At4g27470) proteins, and rice RING (Os4g44820) protein. Amino acid residues that are conserved in at least four of the six sequences are shaded, while amino acids that are identical in all six proteins are shown in black. The solid line denotes the N-terminal RING motif, which is essential for E3 Ub ligase activity. The C-terminal putative membrane anchoring sequence is indicated by an asterisk. Dashes show gaps in the amino acid sequences that were introduced to optimize alignment. (C) Sequence alignment of the RING domain of Rma1H1 and other RING proteins. The sequences of RING motifs in hot pepper Rma1H1, Arabidopsis Rma1, Rma2, and Rma3, poplar Pta-Ring protein, rice RING protein, and human Hs-Rma1 are shown. Amino acid residues that are conserved in at least four of the seven sequences are shaded. Amino acids that are identical in all seven proteins are shown in black. Putative Zn2+-interacting amino acid residues are indicated. The numbers on the right indicate the amino acid residues. Dashes show gaps in the amino acid sequences that were introduced to optimize alignment.
Figure 2.
Figure 2.
In Vitro Self-Ubiquitination Assay of Rma1H1. (A) The bacterially expressed MBP-Rma1H1 fusion protein was incubated for the indicated time periods in the presence of E1, E2, ATP, and Ub. Samples were resolved by 8% SDS-PAGE and subjected to immunoblot analysis with anti-MBP antibody (left pane) or anti-Ub antibody (right panel). (B) MBP-Rma1H1 and MBP-Rma1H1C61S mutant protein were incubated at 30°C for 60 min in the presence or absence of E1, E2, and/or Ub. Samples were analyzed as described above. (C) Wild-type MBP-Rma1H1 and single amino acid substitution mutants were used in the E3 Ub ligase enzyme assay. Amino acid residues in the RING motif that are used for the substitution mutations are indicated. Arrows indicate nonubiquitinated MBP-Rma1H1.
Figure 3.
Figure 3.
Induction Kinetics of Rma1H1 in Response to Conditions of Environmental Stress in Hot Pepper Plants. Light-grown 2-week-old hot pepper seedlings were subjected to drought (A), cold temperature (B), high salinity (C), mechanical wounding (local and systemic) (D), ethylene (E), or ABA (F). Induction profiles of Rma1H1 in leaves and roots (as indicated) were examined by RNA gel blot analysis using 32P-labeled Rma1H1 cDNA as a probe. The ACTIN gene was used as a negative control for drought treatment. The RCI, PINII, and LEAL1 genes were used as positive controls for high salinity, wounding, and ABA, respectively. 18S rRNA was used as a loading control.
Figure 4.
Figure 4.
Increased Tolerance of 35S:Rma1H1 Arabidopsis Transgenic Plants to Water Stress. (A) RT-PCR analysis of 4-week-old wild-type and four independent 35S:Rma1H1 T4 transgenic plants (lines #7, #9, #18, and #22). (B) Wild-type and transgenic lines were grown in pots for 3 weeks under normal growth conditions. Thereafter, water was withheld for 12 d, followed by rewatering for 3 d. Dehydration tolerance was assayed as the capability of plants to resume growth when returned to normal conditions following water stress. The survival rate of wild-type and four independent transgenic lines are shown. Error bars are ±sd (n = 5). (C) Water loss of wild-type and 35S:Rma1H1 leaves before and after drought stress. Water loss is expressed as the percentage of initial fresh weight of detached leaves. Error bars are ±sd (n = 10).
Figure 5.
Figure 5.
Rma1H1 Localizes to the ER Membrane in Arabidopsis. (A) Localization of GFP-Rma1H1. Wild-type protoplasts were transformed with 35S:GFP-Rma1H1 or 35S:BiP-GFP, and localization of the green fluorescence signal was examined. Bars = 20 μm. (B) Colocalization of HA-Rma1H1 with GKX. Protoplasts were cotransformed with 35S:HA-Rma1H1 and 35S:GKX. Localization of HA-Rma1H1 was examined by immunohistochemistry using anti-HA antibody (red signal), while the green fluorescence signal of GKX was observed directly. The green fluorescent signal of 35S:GFP was closely overlapped with the red signal of 35S:HA-Rma1H1. Transformed protoplasts were also viewed under bright-field conditions. Bars = 20 μm. (C) Immunoblot analyses of GFP-Rma1H1 and HA-Rma1H1. Protein extracts from transformed protoplasts or untransformed control protoplasts were analyzed using anti-GFP or anti-HA antibody. The asterisk indicates 55-kD GFP-Rma1H1 fusion protein. (D) Subcellular distribution of HA-Rma1H1. Protein extracts from protoplasts transformed with 35S:HA-Rma1H1 were separated into soluble (S) and membrane (M) fractions by ultracentrifugation and analyzed by protein gel blotting using anti-HA antibody. PEP12 and AALP were used as controls for membrane and soluble fractions, respectively. T, total protein extracts.
Figure 6.
Figure 6.
HA-Rma1H1 Reduces PIP2;1 Protein Levels in a 26S Proteasome-Dependent Manner. (A) HA-Rma1H1-induced reduction of PIP2;1 level. Protoplasts were cotransformed with indicated constructs, and protein extracts were analyzed by protein gel blotting using various antibodies as indicated. Actin levels were detected as a loading control with anti-actin antibody. Two circles indicates PIP2;1 in dimeric form, while one circle indicates PIP2;1 as monomer. The asterisk shows HA-Rma1H1, which was detected at the same time as PIP2;1-HA because it is also HA tagged. (B) Effect of MG132 on PIP2;1-HA levels. Protoplasts cotransformed with 35S:PIP2;1-HA and 35S:HA-Rma1H1 were incubated with MG132, and protein extracts were analyzed using anti-RFP and anti-HA antibodies. Lhcb4 levels were detected as a loading control with anti-Lhcb4 antibody. (C) to (E) Reduction of PIP2;1-GFP in 35S:Rma1H1/35S:PIP2;1-GFP double transgenic plants. PIP2;1-GFP levels were determined by fluorescent microscopy (C) or by protein gel blot analysis using anti-GFP antibody (D). The degree of PIP2;1-GFP reduction in six independent DT lines was quantified by measuring the intensity of the three bands of PIP2;1-GFP from the protein gel blotting (E). RbcS stained with Coomassie blue was used as a loading control. Bars = 50 μm. Error bars are ±sd (n = 5). [See online article for color version of this figure.]
Figure 7.
Figure 7.
Overexpression of Rma1H1 Inhibits Trafficking of PIP2;1. (A) Localization of PIP2;1 in protoplasts. Protoplasts were transformed with the indicated constructs, and localization of PIP2;1-mRFP or PIP2;1-GFP was examined. The population of PIP2;1-transformed protoplasts included three different patterns of mRFP or GFP localization: the ER network pattern, plasma membrane pattern, or localization to both the ER network and plasma membrane. Bars = 20 μm. (B) Quantification of PIP2;1-mRFP and PIP2;1-GFP localization patterns. Protoplasts were cotransformed with the indicated constructs. Protoplasts were counted based on their PIP2;1-mRFP or PIP2-1-GFP localization patterns: the ER-only pattern, plasma membrane only pattern, and the ER plus plasma membrane patterns as shown in (A). More than 150 protoplasts were counted. R6 is the empty vector control. (C) Effect of HA-Rma1H1 on H+-ATPase-GFP. HA-Rma1H1 was transformed into protoplasts together with H+-ATPase-GFP or R6, and localization of H+-ATPase-GFP was examined. Bars = 20 μm. (D) Inhibition of PIP2;1-mRFP trafficking by Rma1H1 in transgenic plants. Protoplasts were prepared from wild-type and Rma1H1-overexpressing transgenic plants and then transformed with 35S:PIP2;1-mRFP or R6. Protoplasts were quantified based on the localization pattern of PIP2;1-mRFP. In total, >300 protoplasts were counted in a triplicate experiment.
Figure 8.
Figure 8.
Rma1H1 Physically Interacts with PIP2;1. (A) Yeast two-hybrid assay. PIP2;1 was cloned into pGADT7, and Rma1H1 and its deletion mutant (Rma1H11-93 and Rma1H194-252) were cloned into pGBKT7. Yeast AH109 cells were cotransformed with a combination of the indicated plasmids. To test protein–protein interactions, yeast cells were plated onto SD/-His/-Trp/-Leu medium including 10 mM 3-amino-1,2,4-triazole. (B) Immunoblot analysis of yeast nuclear and cytosolic proteins. Cytosolic and nuclear protein samples were prepared from yeast cells, in which Myc-PIP2;1 (lane 1), Myc-PIP2;1 + HA-Rma1H1 (lane 2), or HA-Rma1H1 (lane 3) were transformed. Both cytosolic and nuclear extracts of yeast cells were subjected to SDS-PAGE, followed by immunoblot analysis using anti-HA, anti-Myc, anti-GAPDH, or anti-Sir2 antibody. GAPDH and Sir2 were used as fractionation controls for cytosolic and nuclear proteins, respectively. (C) In vitro pull-down assay. MBP-PIP2;1 was incubated with HA-Rma1H1 and amylose affinity resin. The bound protein was eluted from resin and probed with anti-HA or anti-MBP antibody. [See online article for color version of this figure.]
Figure 9.
Figure 9.
In Vivo Ubiquitination of PIP2;1. Intact whole seedlings of wild-type and transgenic T3 seedlings (35S:PIP2;1-GFP and 35S: PIP2;1-GFP/35S:Rma1H1) were incubated with MG132. The whole cell free extracts containing 100 μg proteins were prepared, separated on an 8% SDS-PAGE, and visualized by staining with the Ponceau S solution (left panel). Proteins (500 μg) were then incubated with anti-GFP antibody along with 40 μL protein A-sepharose. Immunoprecipitated proteins were eluted and detected by anti-GFP or anti-Ub-antibody (right panel). Actin was detected as a loading control. Ribulose-1,5-bisphosphate carboxylase/oxygenase (left panel) and IgG (right panel) are indicated by arrows. A PIP2;1-GFP protein band is masked by the IgG signal. The magnitude of relative ubiquitination of PIP2;1-GFP in 35S:PIP2;1-GFP and 35S:PIP2;1-GFP/35S:Rma1H1 transgenic plants was quantified and normalized to 1.00 for the ubiquitinated bands of PIP2;1-GFP in 35S:PIP2;1-GFP plants. Error bars are ±sd (n = 3). [See online article for color version of this figure.]
Figure 10.
Figure 10.
Arabidopsis Rma1 Reduces PIP2;1 Protein Levels and Inhibits Trafficking of PIP2;1 from ER to the Plasma Membrane in the Protoplasts. (A) Localization of GFP-Rma1. Wild-type protoplasts were transformed with 35S:GFP-Rma1 and 35S:BiP-mRFP, and localization of the proteins was examined. Bars = 20 μm. (B) HA-Rma1-induced reduction of PIP2;1-HA level. Protoplasts were cotransformed with indicated constructs, incubated with or without MG132, and protein extracts were analyzed by protein gel blotting using anti-HA antibody. R6 is the empty vector control. Lhcb4 levels were detected as a loading control with anti-Lhcb4 antibody. Two circles indicates PIP2;1-HA in dimeric form, while one circle indicates PIP2;1-HA as monomer. The asterisk shows HA-Rma1, which was detected at the same time as PIP2;1-HA because it is also HA tagged. (C) Quantification of PIP2;1-mRFP and PIP2;1-GFP localization patterns in the presence or absence of Arabidopsis Rma1. Protoplasts were transformed with the indicated constructs, and localization of PIP2;1-mRFP or PIP2;1-GFP was examined. Protoplasts were counted based on their PIP2;1-mRFP or PIP2-1-GFP localization patterns: the ER only pattern, plasma membrane only pattern, and the ER plus plasma membrane patterns. More than 150 protoplasts were counted.
Figure 11.
Figure 11.
Reduced Expression of Rma Homologs Results in the Increased Level of PIP2;1 in the Protoplasts. (A) Schematic representation of the RNAi construct for Rma1 and Rma2. Dark bars indicate coding regions, while gray bars show the 5′- and 3′-untranslated regions. Solid lines reveal introns. Gene-specific forward and reverse primers (F1 and R1) used in the genotyping and RT-PCR are shown with arrows. Double arrows in the 3′-ends of Rma1 and Rma2 indicate the 300-bp region used for RNAi constructs. (B) RT-PCR analysis of Rma1, Rma2, Rma3, Actin8, and Ubiquitin10 mRNAs in wild-type, vector-control transgenic plants, and rma3-knockout/Rma1Rma2-RNAi-knockdown plants (#3, #8, and #11) using gene-specific primers. (C) Quantification of PIP2;1-HA protein levels in 35S:PIP2;1-HA and 35S:PIP2;1-HA/ rma3/Rma1Rma2-RNAi protoplasts. Protoplasts were prepared from wild-type and rma3/Rma1Rma2-RNAi plants (lines #3 and #11), transformed with 35S:PIP2;1-HA, and protein extracts were analyzed by protein gel blotting using anti-HA antibody. Lhcb4 levels were detected as a loading control with anti-Lhcb4 antibody. Two circles indicates PIP2;1-HA in dimeric form, while one circle indicates PIP2;1-HA as monomer.

References

    1. Abrami, L., Kunz, B., Iacovache, I., and van der Goot, F.G. (2008). Palmitoylation and ubiquitination regulate exit of the Wnt signaling protein LRP6 from the endoplasmic reticulum. Proc. Natl. Acad. Sci. USA 105 5384–5389. - PMC - PubMed
    1. Aharon, R., Shahak, Y., Wininger, S., Bendov, R., Kapulnik, Y., and Galili, G. (2003). Overexpression of a plasma membrane aquaporin in transgenic tobacco improves plant vigor under favorable growth conditions but not under drought or salt stress. Plant Cell 15 439–447. - PMC - PubMed
    1. Alexandersson, E., Fraysse, L., Sjovall-Larsen, S., Gustavsson, S., Fellert, M., Karlsson, M., Johanson, U., and Kjellbom, P. (2005). Whole gene family expression and drought stress regulation of aquaporins. Plant Mol. Biol. 59 469–484. - PubMed
    1. Benghezal, M., Wasteneys, G.O., and Jones, D.A. (2000). The C-terminal dilysine motif confers endoplasmic reticulum localization to type I membrane proteins in plants. Plant Cell 12 1179–1201. - PMC - PubMed
    1. Bohnert, H.J., Gong, Q., Li, P., and Ma, S. (2006). Unraveling abiotic stress tolerance mechanisms - Getting genomics going. Curr. Opin. Plant Biol. 9 180–188. - PubMed

Publication types

MeSH terms