. 2009 Mar;174(3):1097-108.
doi: 10.2353/ajpath.2009.080431.

Coronary intraplaque hemorrhage evokes a novel atheroprotective macrophage phenotype

Affiliations

Coronary intraplaque hemorrhage evokes a novel atheroprotective macrophage phenotype

Joseph J Boyle et al. Am J Pathol. 2009 Mar.

Abstract

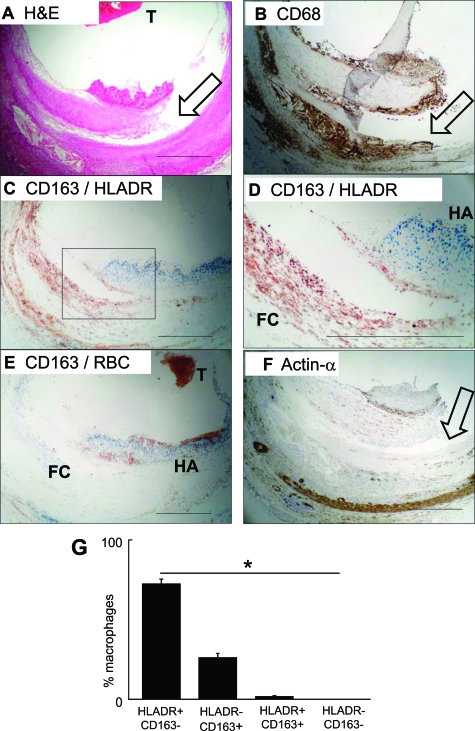
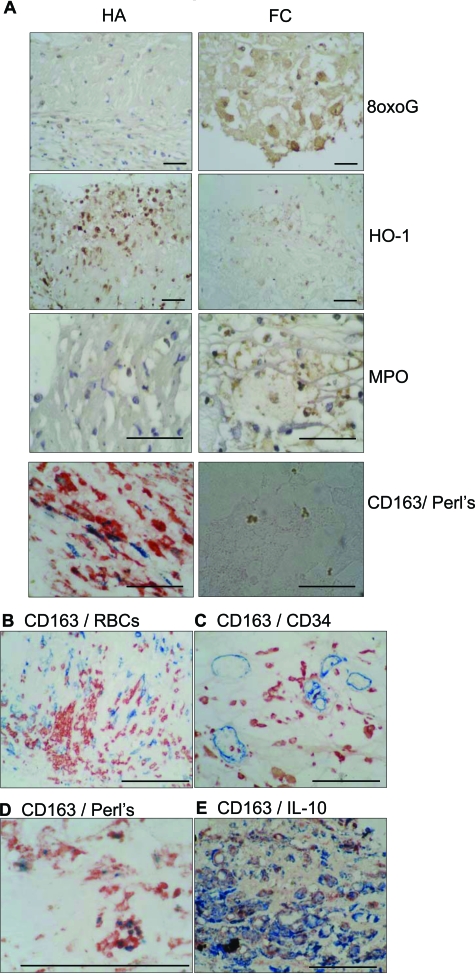
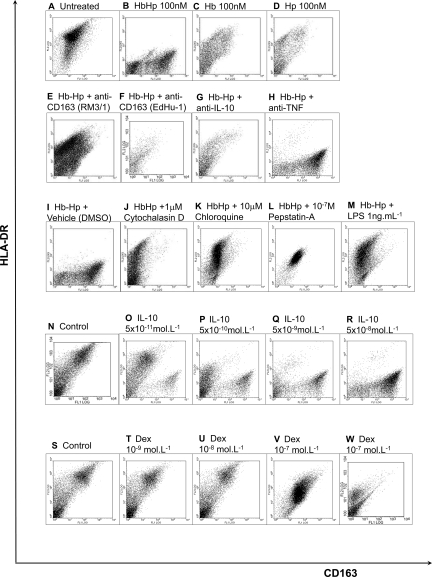
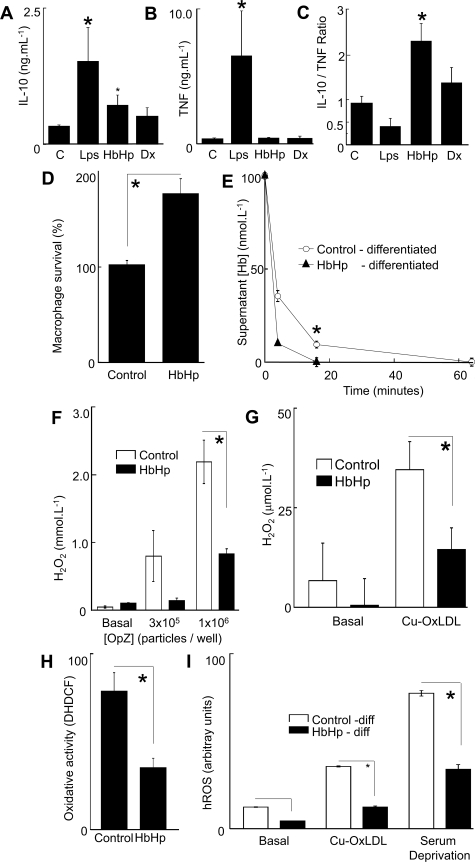
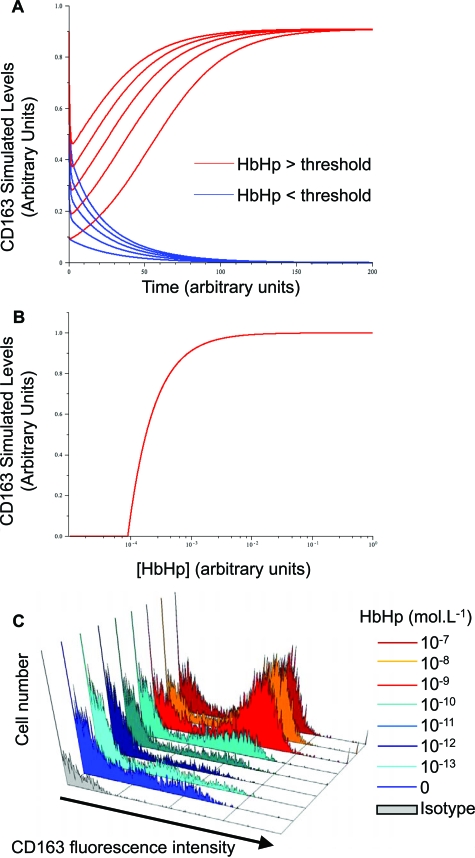
Intraplaque hemorrhage accelerates atherosclerosis via oxidant stress and contributes to lesion development and destabilization. Normally, macrophages scavenge hemoglobin-haptoglobin (HbHp) complexes via CD163, and this process provokes the secretion of the anti-inflammatory atheroprotective cytokine interleukin (IL)-10. We therefore tested the hypothesis that HbHp complexes may drive monocyte differentiation to an atheroprotective phenotype. Examination of the macrophage phenotype in hemorrhaged atherosclerotic plaques revealed a novel hemorrhage-associated macrophage population (HA-mac), defined by high levels of CD163, but low levels of human leukocyte antigen-DR. HA-mac contained more iron, a pro-oxidant catalyst, but paradoxically had less oxidative injury, measured by 8-oxo-guanosine content. Differentiating monocytes with HbHp complexes reproduced the CD163(high) human leukocyte antigen-DR(low) HA-mac phenotype in vitro. These in vitro HA-mac cells cleared Hb more quickly, and consistently showed less hydrogen peroxide release, highly reactive oxygen species and oxidant stress, and increased survival. Differentiation to HA-mac was prevented by neutralizing IL-10 antibodies, indicating that IL-10 mediates an autocrine feedback mechanism in this system. Nonlinear dynamic modeling showed that an IL-10/CD163-positive feedback loop drove a discrete HA-mac lineage. Simulations further indicated an all-or-none switch to HA-mac at threshold levels of HbHp, and this conversion was experimentally verified. These data demonstrate the creation of a novel atheroprotective (HA-mac) macrophage subpopulation in response to intraplaque hemorrhage and raise the possibility that therapeutically reproducing this macrophage phenotype may be cardio-protective in cases of atherosclerosis.


Figures

Figure 1
Figure 1
Human culprit plaques contain a hemorrhage-associated macrophage subset. Results are representative of eight ruptured plaques. Scale bars = 500 μm. A: H&E stain, low power view of a culprit lesion with plaque rupture. T = thrombus. Arrow = plaque fissure. B: CD68 immunolabeling (immunoperoxidase-DAB, brown), using clone KP1. Clone PG-M1 staining was equivalent. Arrow = plaque fissure. C: CD163/HLA-DR double immunolabeling, low power. Blue = CD163, red = HLA-DR. Box = area shown at higher magnification in (D), which includes a fibrous cap infiltrated by macrophages and an area of hemorrhage. D: CD163/HLA-DR double immunolabeling, high power. Blue = CD163, red = HLA-DR. FC = foam cell macrophages. HA = hemorrhage associated macrophages. Serial sections of these are also shown in zones HA & FC in Supplemental Figure S4 at http://ajp.amjpathol.org. E: CD163/erythrocyte (RBC) double immunolabeling. Blue = CD163, red = RBC marker glycophorin-c. T = thrombus. F: α-smooth muscle actin immunolabeling (immunoperoxidase-DAB, brown). Arrow = plaque fissure. G: Quantification of subsets. Macrophages of each subset were counted and expressed as a proportion of macrophages in each lesion and then summarized as mean and SE for all eight available ruptured plaques. *Statistically significant distribution, analysis of variance, P < 10−8.
Figure 2
Figure 2
A: Reciprocal oxidative stress and iron content in CD163high (HA-mac) and CD163low (foam cell) macrophages Left column: photomicrographs of macrophages in area identified as hemorrhage-associated (HA). Right column, photomicrographs of macrophages in area identified as foam cell rich (FC). Scale bars = 40 μm. Rows, immunolabeling as indicated, respectively for 8-oxo-guanosine (8-oxo-G); heme-oxygenase-1 (HO-1), and myeloperoxidase (MPO). The bottom row are double-labeled for CD163 (red)/iron (Perl’s stain; blue). Note Perl’s negative golden particles in the FC region are well described as OxLDL-derived ceroid. Brown is immunoperoxidase-DAB, and blue is hematoxylin counterstain. B–E: Ruptured plaque CD163+ macrophages, hemorrhage, iron, and IL10. Images correspond to area HA of (A), in serial sections, and are representative of the eight culprit plaques. Scale bars = 100 μm. B: CD163 (blue immuno-alkaline phosphatase)/glycophorin C (erythrocytes, red immunoperoxidase) C: CD163/CD34. CD163 (red immunoperoxidase)/CD34 (endothelial cells, blue immuno-alkaline phosphatase); D: CD163/Perl’s iron histochemistry. CD163 (red immunoperoxidase)/iron (blue, histochemistry with Perl’s stain; ie, Prussian blue ferricyanide reaction). E: CD163/IL10 CD163 (blue immuno-alkaline phosphatase)/IL10 (red immunoperoxidase).
Figure 3
Figure 3
Mechanisms causally linking Hb to HA-mac phenotype. Human peripheral blood monocytes were incubated in the presence of Hb, Hp, HbHp complexes, with vehicle, cytokines, or antagonists at the indicated concentrations. After 8 days of culture, macrophages were detached and dual stained for CD163 (FITC) and HLA-DR (PE). Representative flow cytometric dot plots are presented for at least five experiments from separate donors, with greater than twenty experiments examining the effects of HbHp complexes versus control. For each, the x axis is CD163 and the y axis is HLA-DR (isotype controls were in the first quadrant, not shown). The vehicle control for cytochalasin-D and chloroquine was DMSO. Dex = dexamethasone. Anti-TNF and anti-IL10 = functionally antagonistic antibodies to TNF-α and IL10 respectively. LPS = E. Coli lipopolysaccharide. Hp:Hp complexes were used at 100 nmol/L (10−7mol/L). Key: A: Unstimulated culture of day 8 macrophages. B: Incubated with HbHp complexes at 10−7mol/L, 100 nmol/L. C: Incubated with Hb at 10−7mol/L, 100 nmol/L. D: Incubated with Hp at 10−7mol/L, 100 nmol/L. E: As (B), with addition of anti-CD163 clone RM3/1, 70 nmol/L. F: As (B), with addition of anti-CD163 clone EdHu-1, 70 nmol/L. G: As (B), with addition of anti-IL10 Mab217, 70 nmol/L. H: As (B), with addition of anti-TNF-α Mab225, 70 nmol/L. I: As (B), with addition of DMSO, 1:1000. J: As (B), with addition of 10−6 M/L cytochalasin-D in DMSO, 1:1000. K: As (B), with addition of 10−6 M/L chloroquine in DMSO, 1:1000. L: As (B), with addition of 10−7 M/L, pepstatin-A in DMSO, 1:1000. M: As (B), with addition of LPS, 1 ng/ml. N: Control (unstimulated) culture of macrophages at day 8. O: Incubated with 5 × 10⁻¹¹mol/L (50 pM) IL10 from outset of culture. P: As (O), but with 5 × 10⁻¹⁰mol/L (500 pM) IL10. Q: As (O), but with 5 × 10⁻⁹mol/L (5 nmol/L) IL10. R: As (O), but with 5 × 10⁻⁸mol/L (50 nmol/L) IL10. S: Unstimulated culture of macrophages at day 8. T: Incubated with 10−9mol/L (1 nmol/L) dexamethasone from outset of culture. U: As (T), but with 10−8mol/L (10 nmol/L) dexamethasone. V: As (T), but with 10−7mol/L (100 nmol/L) dexamethasone. W: As (T), but with 10−6mol/L (1 μmol/L) dexamethasone.
Figure 4
Figure 4
Homeostatic phenotype of HA-mac A–C: x-axes, respective stimuli, control medium (10% AHS IMDM); LPS = E. Coli lipopolysaccharide (10 ng/ml); HbHp = HbHp complexes (100 nmol/L; 10−7mol/L); Dx = dexamethasone (10 nmol/L; 10−8mol/L). A: y axis, Absolute IL10 levels in supernatants in monocyte-macrophage cultures 24 hours after addition of stimuli at the start of culture. (*P < 0.001 analysis of variance overall, with P < 0.05 relative to control, Bonferroni adjusted post-test, values are mean + SEM of five donors). B: y axis, Absolute TNF-α levels in supernatants in monocyte-macrophage cultures 24 hours after addition of stimuli at the start of culture. (*P = 0.006 analysis of variance overall with P < 0.05 relative to control, Bonferroni adjusted post-test, values are mean + SEM of five donors). C: y axis, Ratio of IL10/TNF in panels A and B. (*P = 0.0001 analysis of variance overall with P < 0.05 relative to control with Bonferroni adjusted post-test, n = 5 donors.). Concentration-effect curves (not shown) indicated that the direction of IL10/TNF ratio was maintained at all concentrations of LPS (1 to 1000 ng/ml) and HbHp (10−8 to 10−6 mol/L) D: y axis, macrophage survival as measured by reduction of the colorimetric formazan dye MTS. Viability was measured relative to control cultures (100%). Control = unmodified 10% AHS IMDM; HbHp = 10−7mol/L HbHp complexes added at the start of culture. Student’s t-test *P = 0.000143, values are mean + SEM of five donors). E: y axis, Hb concentration in medium supernatant at 4 minutes after addition. x axis, time after addition of HbHp complexes (10−7mol/L), measuring supernatant [Hb] spectrophometrically at 412 nm. Open circles, macrophages were incubated in control medium (10% AHS IMDM) for 8 days. Filled triangles, macrophages were differentiated with HbHp complexes (10−7mol/L) for 8 days. Student’s t-test *P = 0.000283. F: y axis, specific H2O2 production as measured by Amplex Red/peroxidase (see Materials and Methods), calibrated by a H2O2 standard curve. Open bars, Control – differentiation in 10% AHS IMDM for 8 days. Filled bars, HbHp – differentiation in added HbHp complexes (10−7mol/L). x axis, addition of opsonised zymosan, a prototypical macrophage oxidative burst stimulant, in two doses to control or HbHp differentiated macrophages. The dose of OpZ, is expressed as particles/well. Data are representative of five independent experiments using separate donors. Student’s t-test *P = 0.0017. G: y axis, H2O2 production as measured by Amplex Red/peroxidase, calibrated by a H2O2 standard curve. x axis, addition of OxLDL (30 μg/ml) to control or HbHp differentiated (10−7mol/L) macrophages. Open bars, Control – differentiation in 10% AHS IMDM for 8 days. Filled bars, HbHp – differentiation in added HbHp complexes (10−7mol/L). Data are representative of five independent experiments using separate donors. Student’s t-test *P = 0.034. H: y axis, oxidative stress as measured by DCFDA fluorescence in macrophages at 8 days cultured in the presence or absence of HbHp (see Materials and Methods). Data are representative of five independent experiments using separate donors. Student’s t-test *P < 0.005. I: y axis, hROS measured as fluorescence of the specific reporter amino-phenyl-fluorescein (APF) (see Materials and Methods). Open bars, Control – differentiation in 10% AHS IMDM for 8 days. Filled bars, HbHp – differentiation in added HbHp complexes (10−7mol/L). x axis, Cu-Ox-LDL, human LDL oxidized in 10μmol/L CuSO4 at 37°C for 18 hours, added at 30 μg/ml. Serum deprivation – medium changed to matched IMDM without AHS. Student’s t-test *P = 9 × 10⁻⁵ (OxLDL) and *P = 3 × 10⁻⁶ (SFM). Data are representative of five independent experiments using separate donors.
Figure 5
Figure 5
Nonlinear dynamics demonstrate that Hb-gated CD163-IL10 feedback drives switching to HA-mac phenotype A: Representative simulated time course of CD163 levels in a simple mathematical model describing the positive feedback loop between CD163 and IL10 given by Equations 1 and 2, see Materials and Methods. Both axes are in arbitrary units. Blue curves show the behavior of CD163 for a low HbHp input ([HbHp] = 0.01 in arbitrary units) for a number of starting values ([CD163] = 0, 2, …, 8). Red curves show behavior for a high HbHp input ([HbHp] = 1) with the same starting levels. Other parameter values are = 10, k1 = 1, k2 = 1, kd1 = 1, kd2 = 1 (arbitrary units) and the initial level of IL10 is 0.5 (arbitrary units) in all cases. The qualitative behavior is independent of this choice, and similar threshold behavior can be observed for all choices of k1, k2, kd1 and kd2 as long as the sensitivity of CD-163 to IL10 is sufficiently high ([R] > k1 k2 kd1, SOM). B: Variation of final steady state values of CD163 and IL10 with HbHp input (all given in arbitrary units). Other parameter values are = 10, k1 = 1, k2 = 12, kd1 = 0.75, kd2 = 10−5 (arbitrary units). The steady states were obtained from Equations 3 and 4, SOM and clearly illustrate the threshold, which for these parameter values occurs at H* = 9 × 10⁻⁵. Similar qualitative behavior is seen for all other parameter values as long as > k1 k2 kd1. C: Observed concentration-effect curves for HbHp complexes on CD163 levels by flow cytometry. x axis, fluorescence intensity (CD163 staining (blue or red colors) or isotype control (gray). y axis, cell number. HbHp concentration in culture (expressed in mol/L) is given by the histogram color code as indicated. To match (A), red colors are above threshold and the blue colors below threshold. The experiment is representative of n = 5 donors.

References

    1. Kolodgie FD, Gold HK, Burke AP, Fowler DR, Kruth HS, Weber DK, Farb A, Guerrero LJ, Hayase M, Kutys R, Narula J, Finn AV, Virmani R. Intraplaque hemorrhage and progression of coronary atheroma. N Engl J Med. 2003;349:2316–2325. - PubMed
    1. Virmani R, Kolodgie FD, Burke AP, Finn AV, Gold HK, Tulenko TN, Wrenn SP, Narula J. Atherosclerotic plaque progression and vulnerability to rupture: angiogenesis as a source of intraplaque hemorrhage. Arterioscler Thromb Vasc Biol. 2005;25:2054–2061. - PubMed
    1. Levy AP, Moreno PR. Intraplaque hemorrhage. Curr Mol Med. 2006;6:479–488. - PubMed
    1. Falk E, Shah PK, Fuster V. Coronary plaque disruption. Circulation. 1995;92:657–671. - PubMed
    1. Lin HL, Xu XS, Lu HX, Zhang L, Li CJ, Tang MX, Sun HW, Liu Y, Zhang Y. Pathological mechanisms and dose dependency of erythrocyte-induced vulnerability of atherosclerotic plaques. J Mol Cell Cardiol. 2007;43:272–280. - PubMed

Publication types