. 2009 Mar 1;182(5):2590-600.
doi: 10.4049/jimmunol.0803543.

Amplification of autoimmune response through induction of dendritic cell maturation in inflamed tissues

Affiliations

Amplification of autoimmune response through induction of dendritic cell maturation in inflamed tissues

Kristin Melli et al. J Immunol. .

Abstract

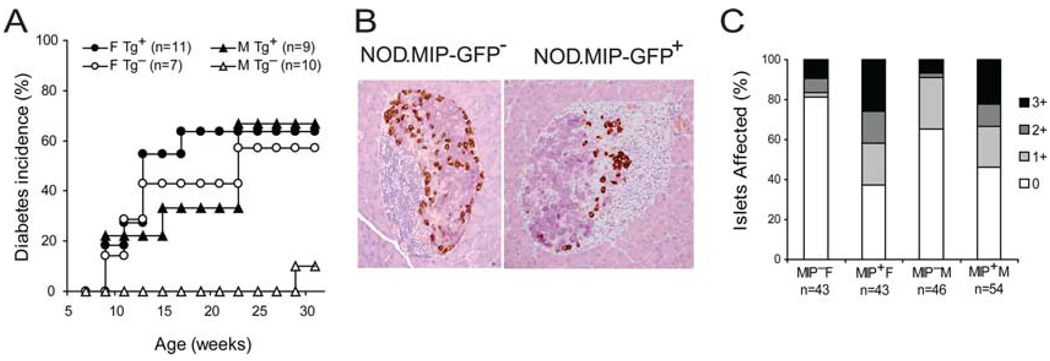
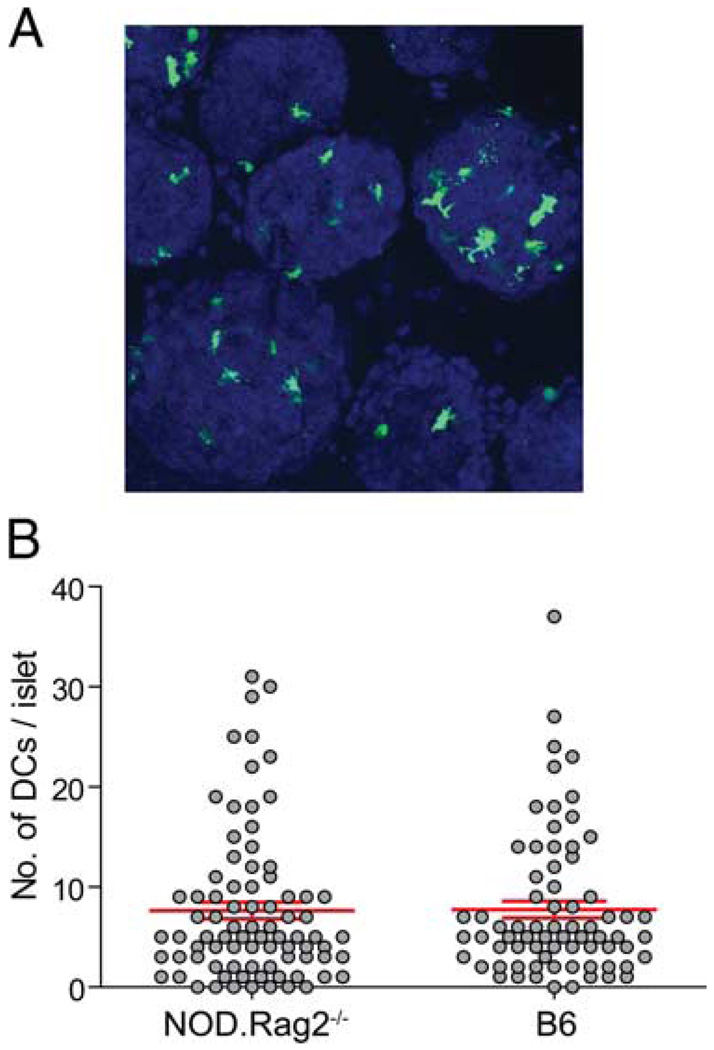
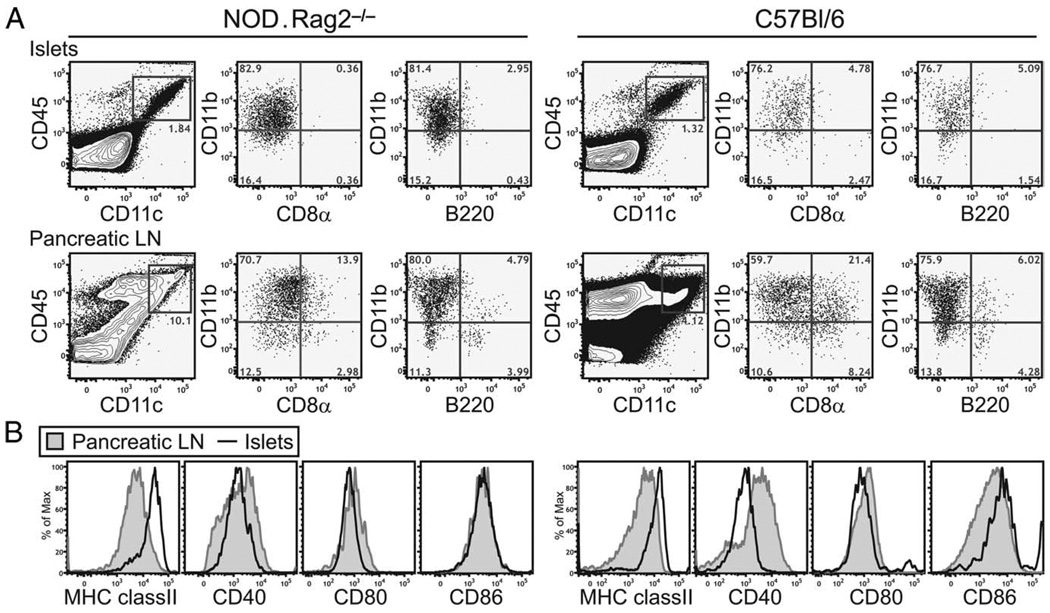
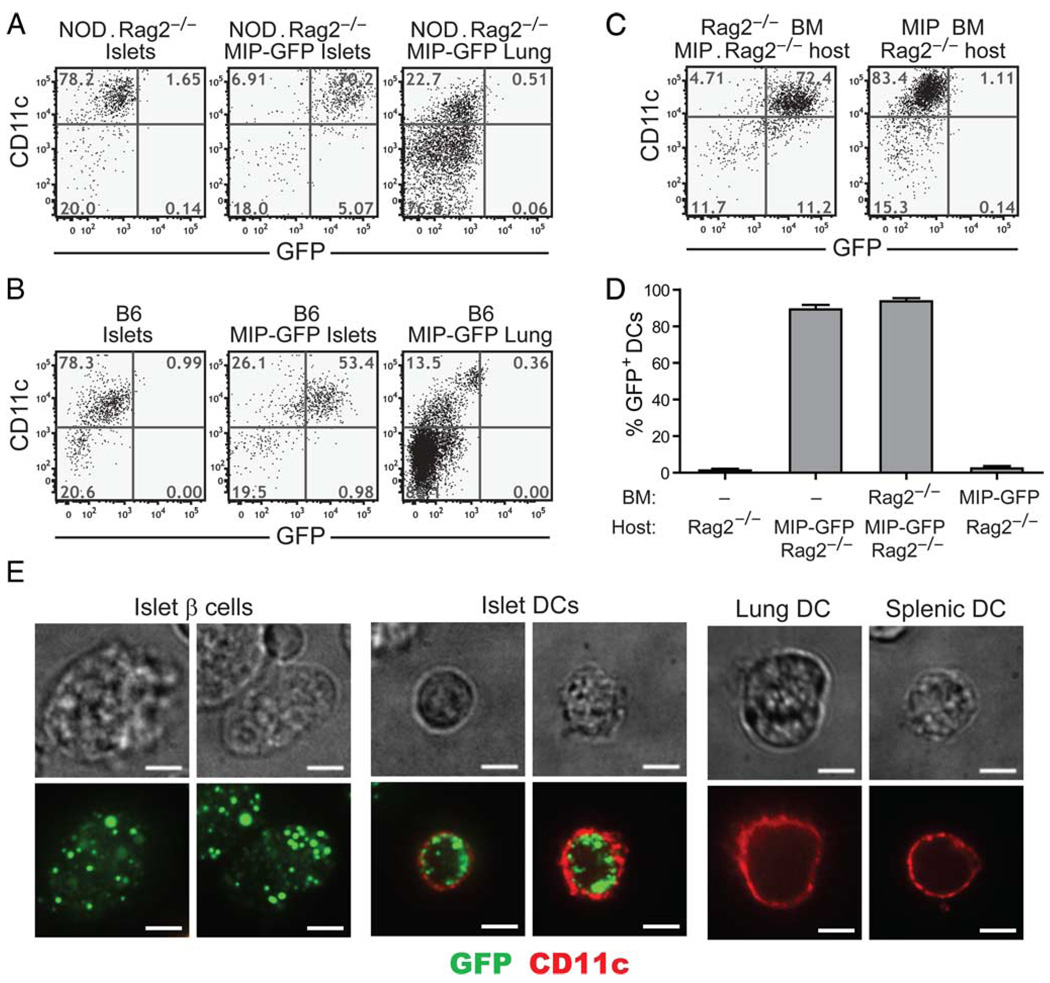
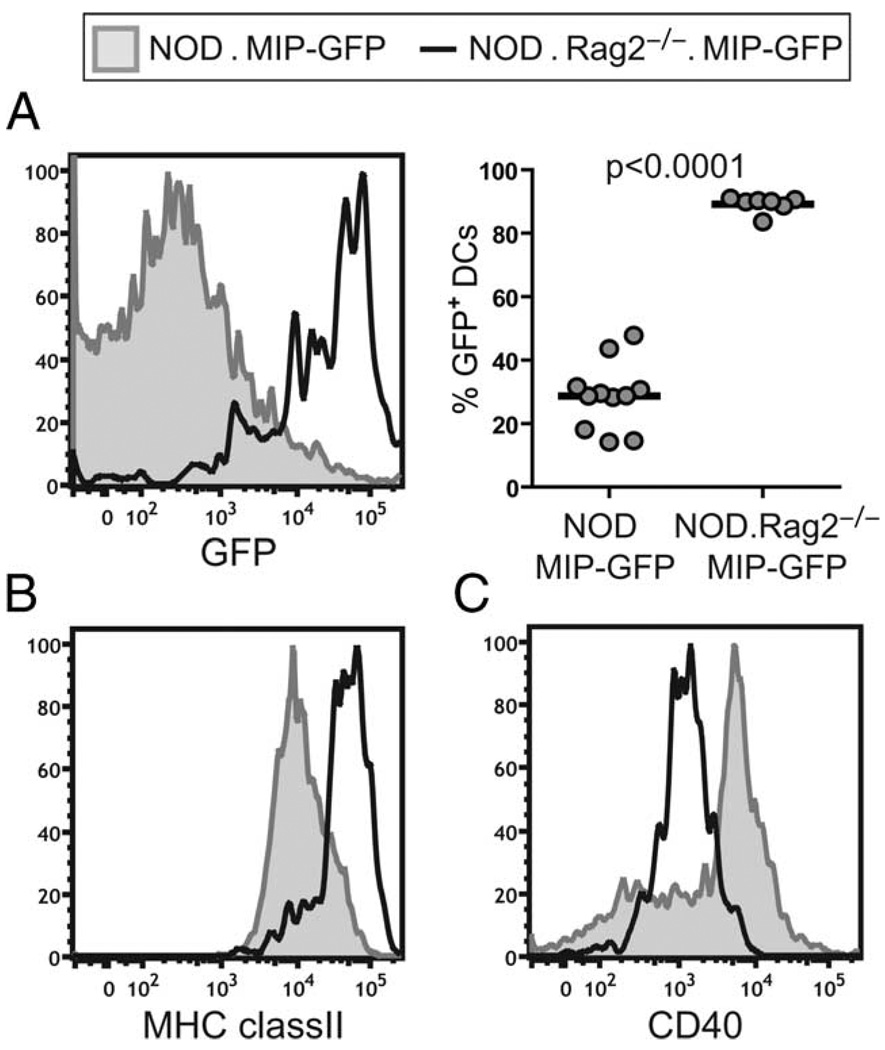
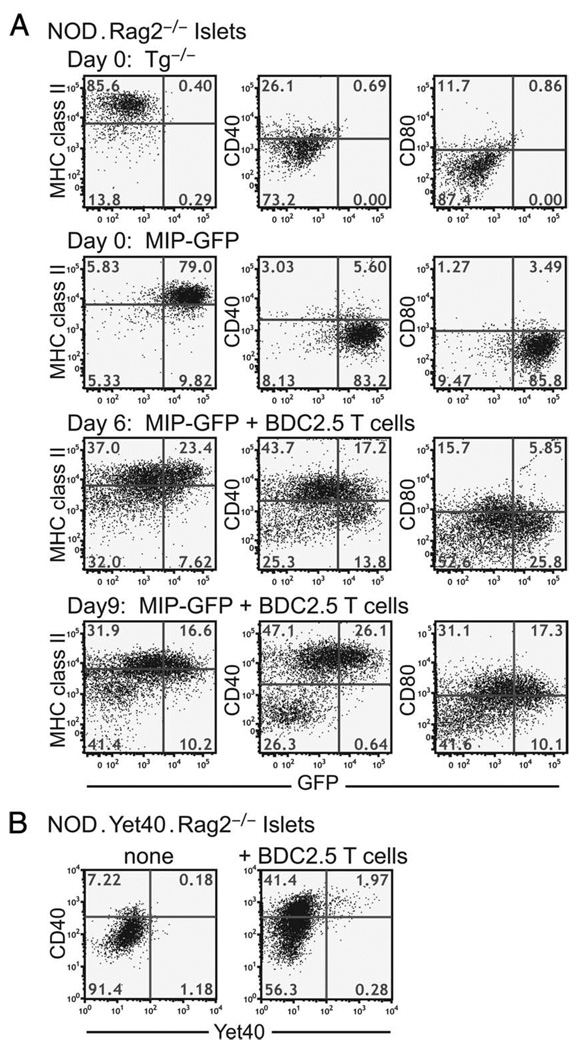
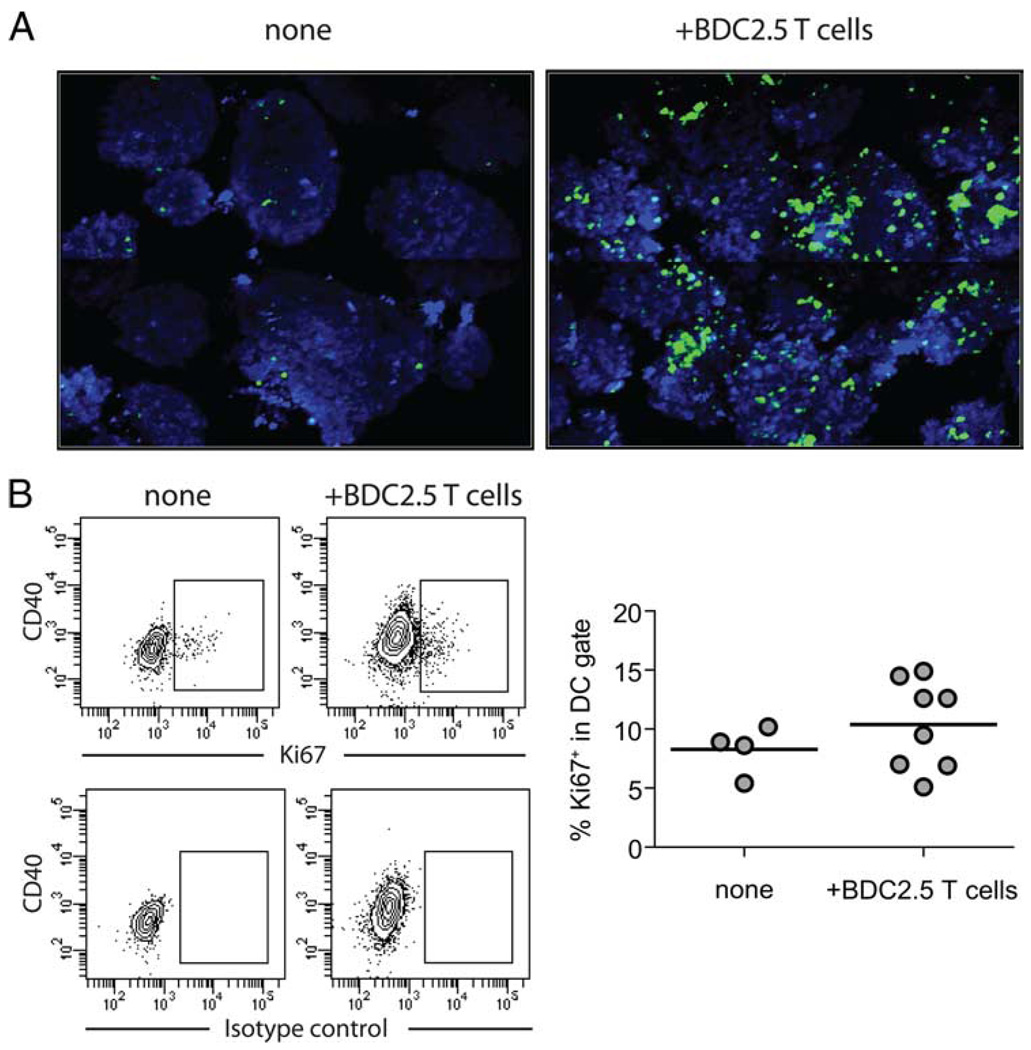
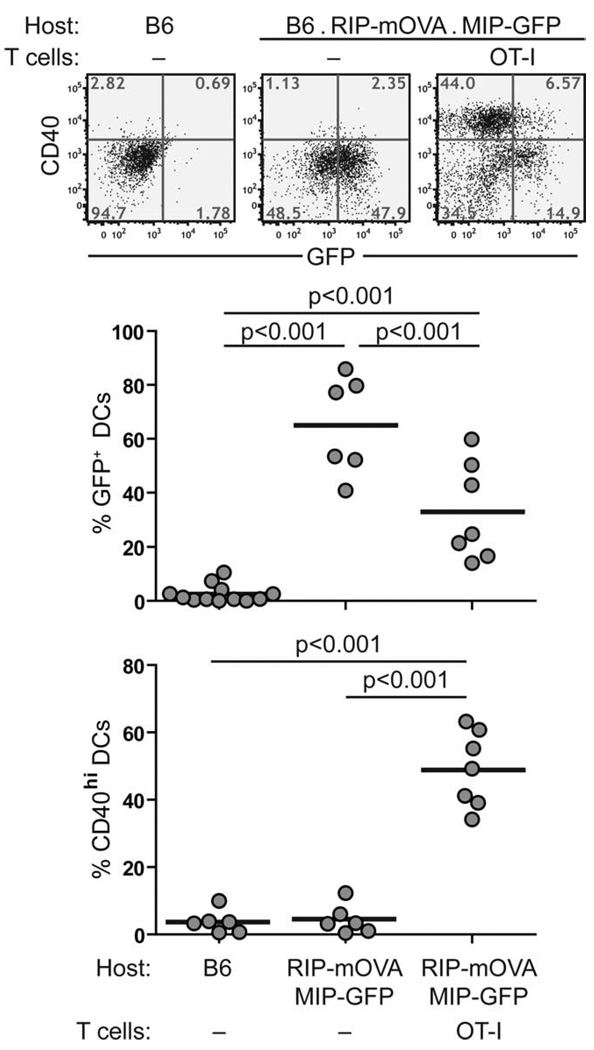
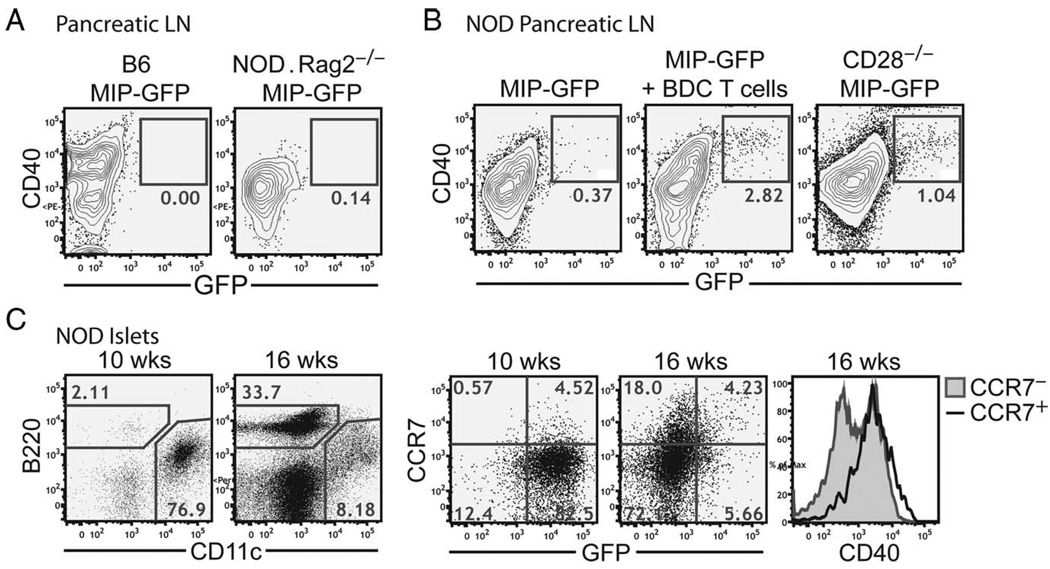
Dendritic cells (DCs) are essential in T cell-mediated destruction of insulin-producing beta cells in the islets of Langerhans in type 1 diabetes. In this study, we investigated T cell induction of intra-islet DC maturation during the progression of the disease in both autoimmune-prone NOD and resistant C57BL/6 mice. We demonstrated steady-state capture and retention of unprocessed beta cell-derived proteins by semimature intra-islet DCs in both mouse strains. T cell-mediated intra-islet inflammation induced an increase in CD40 and CD80 expression and processing of captured Ag by resident DCs without inducing the expression of the p40 subunit of IL-12/23. Some of the CD40(high) intra-islet DCs up-regulated CCR7, and a small number of CD40(high) DCs bearing unprocessed islet Ags were detected in the pancreatic lymph nodes in mice with acute intra-islet inflammation, demonstrating that T cell-mediated tissue inflammation augments migration of mature resident DCs to draining lymph nodes. Our results identify an amplification loop during the progression of autoimmune diabetes, in which initial T cell infiltration leads to rapid maturation of intra-islet DCs, their migration to lymph nodes, and expanded priming of more autoreactive T cells. Therapeutic interventions that intercept this process may be effective at halting the progression of type 1 diabetes.


Conflict of interest statement

Disclosures

The authors have no financial conflict of interest.

Figures

FIGURE 1
FIGURE 1
Phenotype of NOD.MIP-GFP mice. B6.MIP-GFP transgenic mice were backcrossed to the NOD background. A, Diabetes incidence of NOD.MIP-GFP mice and their transgene-negative littermates at nine generations of backcrossing are shown. B, Immunohistological analysis of islets in NOD.MIP-GFP transgenic mice and in transgene-negative littermates at eight generations of backcrossing. The β cells are stained deep purple by aldehyde fuchsin staining. The β, δ, and polypeptide-producing cells are identified by the brown immunohistochemical staining for glucogon, somatostatin, and pancreatic polypeptide, respectively. C, Insulitis score of NOD.MIP-GFP transgenic mice and their transgene-negative littermates at 9–15 wk of age. Numbers of islets analyzed are shown in the category x-axis label.
FIGURE 2
FIGURE 2
Location and numbers of intraislet DCs. Islets were isolated from NOD.CD11c-YFP.Rag2−/− and B6.CD11c-YFP mice, stained with CMTMR or Hoechst 33342, and analyzed by microscopy. A, Maximal z projection of a representative objective field of B6.CD11c-YFP islet imaged. B, Enumeration of numbers of DCs in islets. Each circle represents one islet, and the lines represent mean ± SD (NOD.CD11c-YFP.Rag2−/−, n = 82, mean = 7.65, SD = 7.51; B6.CD11c-YFP, n = 72, mean = 7.75, SD = 7.18).
FIGURE 3
FIGURE 3
Phenotype of intra-islet DCs in steady state. Single-cell suspension of islets and PLNs isolated from NOD.Rag2−/− or B6 mice were analyzed by flow cytometry to determine the cell surface markers expressed by intra-islet DCs. A, Characterization of subtypes of intra-islet DCs. Events shown are gated on live cells (4′,6-diamidino-2-phenylindole (DAPI)). B, Expression of MHC class II and costimulatory molecules expressed on intra-islet DCs (gated on CD45+DAPICD11c+ cells, bold lines) in comparison with DCs in the PLN (shaded histograms). The result is representative of at least two independent experiments in each of the mouse strains.
FIGURE 4
FIGURE 4
Intra-islet DCs in MIP-GFP transgenic mice acquire and maintain intact GFP. Flow cytometric analysis of GFP expression by intra-islet and lung DCs in NOD.Rag2−/−.MIP-GFP (A) and B6.MIP-GFP (B) mice. Events shown are gated on CD45+DAPI cells. The result is a representative of at least two independent experiments. C, Sample flow cytometric profile of GFP signal in intra-islet DCs in radiation bone marrow chimeras is shown. The donor-recipient combinations are indicated on top of each plot. D, Summary of the frequencies of GFP+ cells in DC gate (CD45+DAPICD11c+ cells) in NOD.Rag2−/− (n = 4), NOD.Rag2−/−.MIP-GFP (n = 7), NOD.Rag2−/− into NOD.Rag2−/−.MIP-GFP chimeras (n = 4), and NOD.MIP-GFP into NOD.Rag2−/− chimeras (n = 6). Error bars represent SDs. E, Confocal microscopic analysis of GFP in intra-islet, lung, and splenic DCs in NOD. Rag2−/−.MIP-GFP transgenic mice. Islets and lung cells were dissociated and stained for CD11c (red). The presence of GFP (green) in CD11c (red)-expressing cells was examined by confocal microscopy (original magnification = ×100, scale bar = 5 µm). Fluorescent images show a single medial Z-plane. Phase-contrast images are shown on top for reference. The result is a representative of five independent experiments.
FIGURE 5
FIGURE 5
Phenotype of intra-islet DCs in NOD.MIP-GFP mice. Single-cell suspension of islets isolated from NOD.MIP-GFP or NOD.MIP-GFP. Rag2−/− was analyzed by flow cytometry. Histogram overlays of GFP fluorescence (A, left) and cell surface expression of MHC class II (B), and CD40 (C) in NOD.MIP-GFP (shaded histograms) vs NOD.MIP-GFP. Rag2−/− (bold lines) are shown. A summary chart of percentages of GFP+ cell DC gate (CD45+DAPICD11c+) in the islets of NOD.MIP-GFP (n = 11) and NOD.MIP-GFP.Rag2−/− (n = 7) mice is shown (A, right). The p value was obtained using unpaired Student’s t test with Welch’s correction.
FIGURE 6
FIGURE 6
Kinetic changes in DCs in inflamed islets. A, NOD.MIP-GFP.Rag2−/− mice received CD4+CD25 cells from BDC2.5 TCR transgenic mice. GFP fluorescence and cell surface expression of MHC class II, CD40, and CD80 on intra-islet DCs were analyzed by flow cytometry on days 6 and 9 after cell transfer. Examples of a NOD.Rag2−/− and a NOD.MIP-GFP.Rag2−/− mouse without T cell transfer are shown for comparison. This result is representative of at least five independent experiments. B, NOD.Yet40.Rag2−/− mice received CD4+CD25 cells from BDC2.5 TCR transgenic mice. On day 8 postcell transfer, the presence of YFP signal among intra-islet DCs was assessed by flow cytometry. An age-matched untreated NOD.Yet40. Rag2−/− sample is shown for comparison. This result represents two independent experiments. Events shown are gated on CD45+DAPICD11c+ cells in islets.
FIGURE 7
FIGURE 7
Increase of DC numbers in inflamed islets. A, Islets were isolated from untreated NOD.CD11c-YFP.Rag2−/− mice (left) or from similar mice 8 days after transferring CD4+CD25 cells from BDC.2.5 TCR transgenic mice (right) were counterstained with CMTMR (shown in blue) and imaged on a two-photon microscope. The images are collages of consecutive objective fields representing imaging volume of 780 × 618 × 176 µm3 for untreated islets (left) and 780 × 618 × 222 µm3 for inflamed islets (right). B, Islets were isolated from untreated NOD.Rag2−/− mice and similar mice 6–7 days after receiving CD4+ CD25 cells from BDC2.5 TCR transgenic mice. Expression of Ki67 by intra-islet DCs was analyzed by flow cytometry. Sample contour plots of anti-Ki67 staining and isotype control Ab staining patterns are shown, and a chart summarizing results from two independent experiments is shown below. Events shown are gated on CD45+ CD11c+ cells. Each circle represents one islet, and the lines represent mean of the group.
FIGURE 8
FIGURE 8
Phenotypic changes in intra-islet DCs in B6.MIP-GFP.RIP-mOVA mice after inflammation was induced. B6.MIP-GFP.RIP-mOVA mice received CD8+ cells from OT-I TCR transgenic mice. GFP fluorescent and cell surface expression of CD40 on intra-islet DCs were analyzed by flow cytometry on day 5 after cell transfer and compared with those from untreated B6 and B6.MIP-GFP.RIP-mOVA mice. Representative dot plots are shown on top, and a summary of all mice analyzed is shown in the chart on the bottom. Values of p were obtained using a one-way ANOVA test with Tukey’s post-test. The result represents four independent experiments.
FIGURE 9
FIGURE 9
Migration of intra-islet DCs to the PLNs. A, Flow cytometric analysis of GFP signal in DCs in the PLNs of B6.MIP-GFP (left) or NOD.MIP-GFP.Rag2−/− (right) mice. Events shown are gated on CD45+DAPICD11c+ cells. B, Flow cytometric analysis of GFP+ DCs in the PLNs of NOD.MIP-GFP mice (left), NOD.MIP-GFP mice 5 days after injection of activated CD4+CD25 cells from BDC.2.5 TCR transgenic mice (middle), and 7-wk-old NOD.MIP-GFP.CD28−/− mice (right). Results are representative of at least two independent experiments. C, Flow cytometric analysis of CCR7 expression on intra-islet DCs in prediabetic NOD.MIP-GFP mice. Contour plots show lymphocytic infiltration into the islets of representative early prediabetic mice (10 wk) vs late prediabetic mice (16 wk), and are gated on CD45+DAPI cells. The histogram overlay (top) shows CCR7 expression in the CD45+DAPICD11c+ population from the early vs late prediabetic islets. Histogram overlays (below) show GFP fluorescence and CD40 expression in the CCR7+ vs CCR7 populations of intra-islet DCs from late prediabetic mice.

References

    1. Turley S, Poirot L, Hattori M, Benoist C, Mathis D. Physiological β cell death triggers priming of self-reactive T cells by dendritic cells in a type-1 diabetes model. J. Exp. Med. 2003;198:1527–1537. - PMC - PubMed
    1. You S, Belghith M, Cobbold S, Alyanakian MA, Gouarin C, Barriot S, Garcia C, Waldmann H, Bach JF, Chatenoud L. Autoimmune diabetes onset results from qualitative rather than quantitative age-dependent changes in pathogenic T-cells. Diabetes. 2005;54:1415–1422. - PubMed
    1. Gregori S, Giarratana N, Smiroldo S, Adorini L. Dynamics of pathogenic and suppressor T cells in autoimmune diabetes development. J. Immunol. 2003;171:4040–4047. - PubMed
    1. Tang Q, Adams JY, Penaranda C, Melli K, Piaggio E, Sgouroudis E, Piccirillo CA, Salomon BL, Bluestone JA. Central role of defective interleukin-2 production in the triggering of islet autoimmune destruction. Immunity. 2008;28:687–697. - PMC - PubMed
    1. Hart DN, Fabre JW. Demonstration and characterization of Ia-positive dendritic cells in the interstitial connective tissues of rat heart and other tissues, but not brain. J. Exp. Med. 1981;154:347–361. - PMC - PubMed

Publication types

MeSH terms

Substances