. 2009 Mar 1;182(5):2868-78.
doi: 10.4049/jimmunol.0802368.

Transitional B cells exhibit a B cell receptor-specific nuclear defect in gene transcription

Affiliations

Transitional B cells exhibit a B cell receptor-specific nuclear defect in gene transcription

Sarah F Andrews et al. J Immunol. .

Abstract

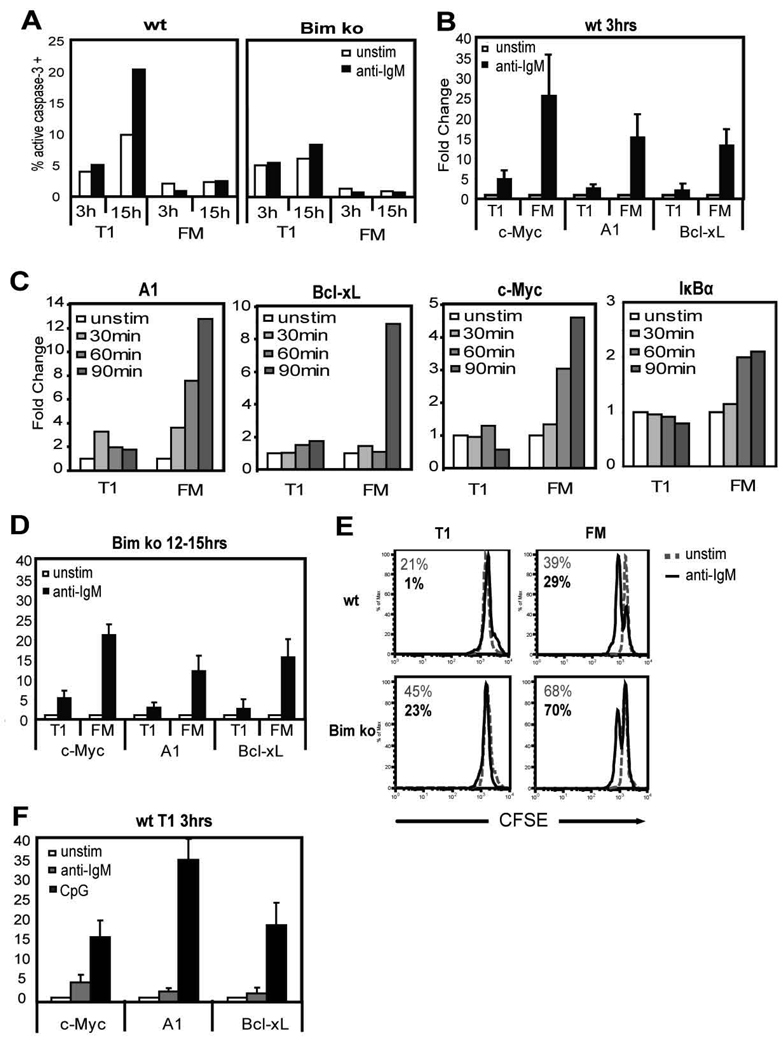
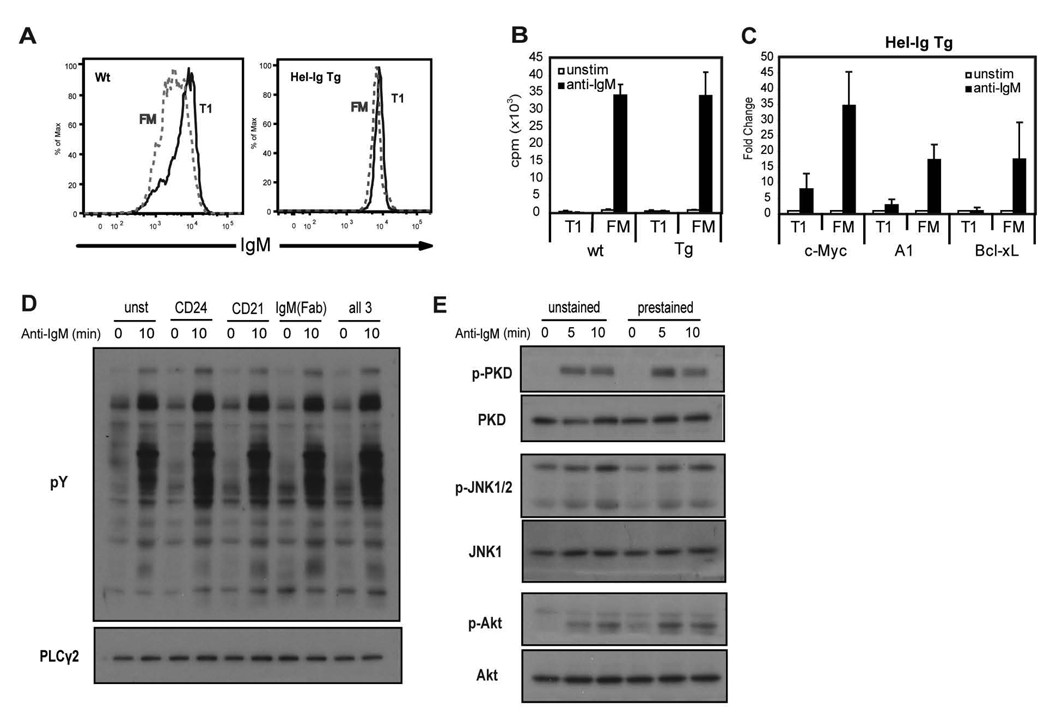
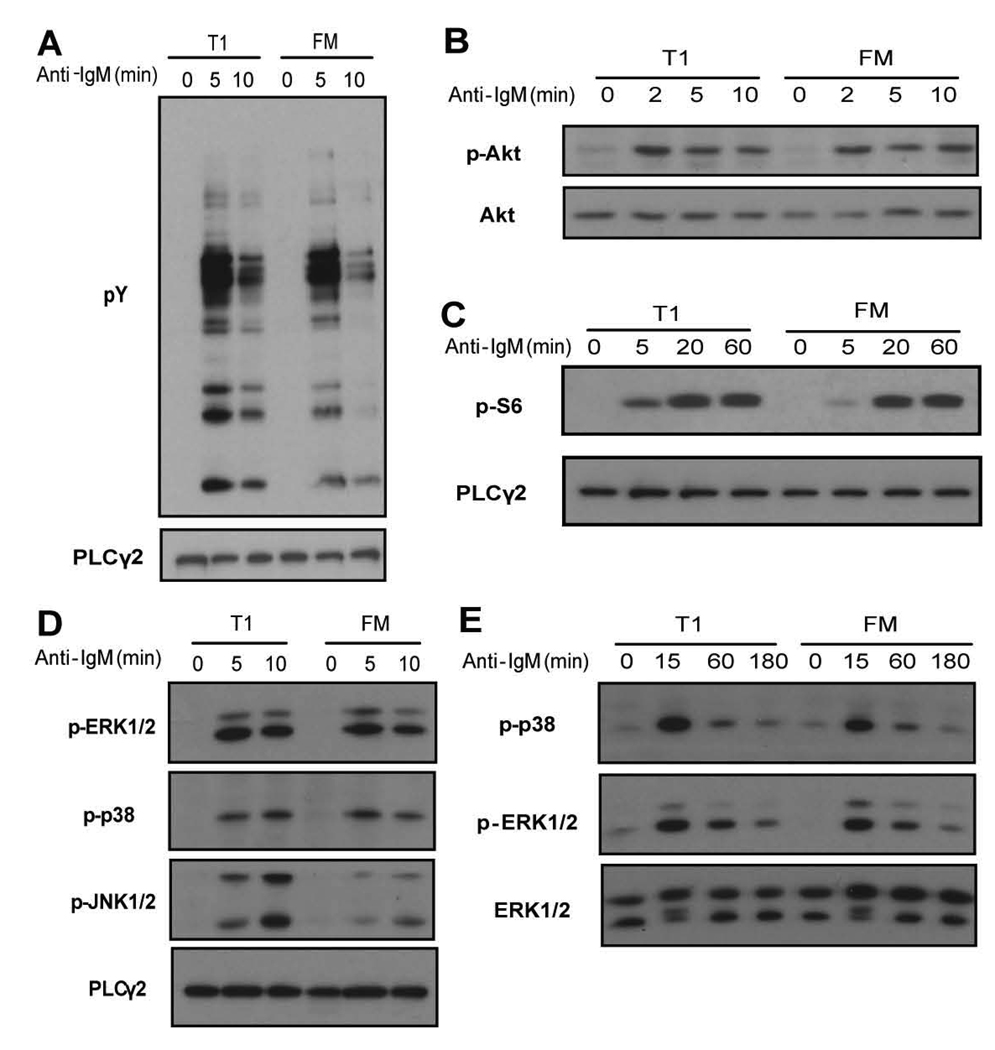
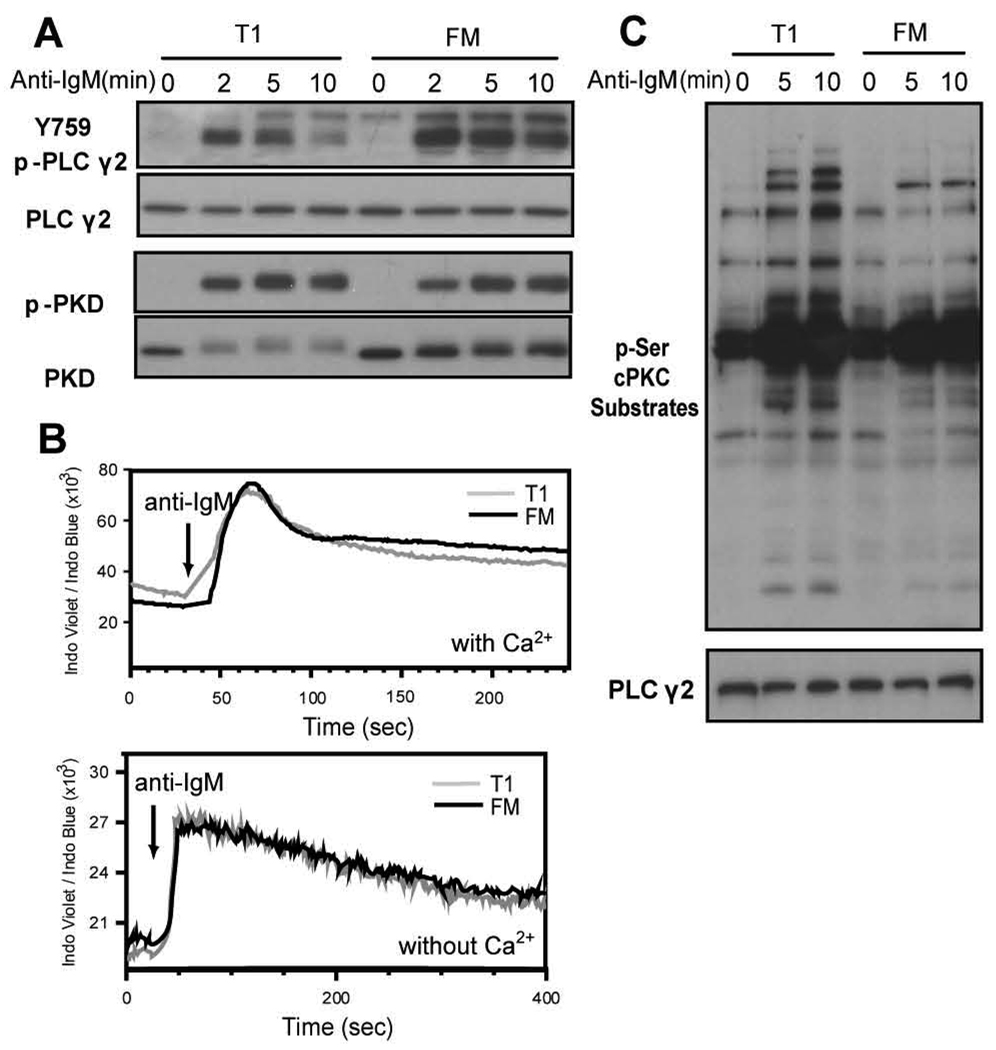
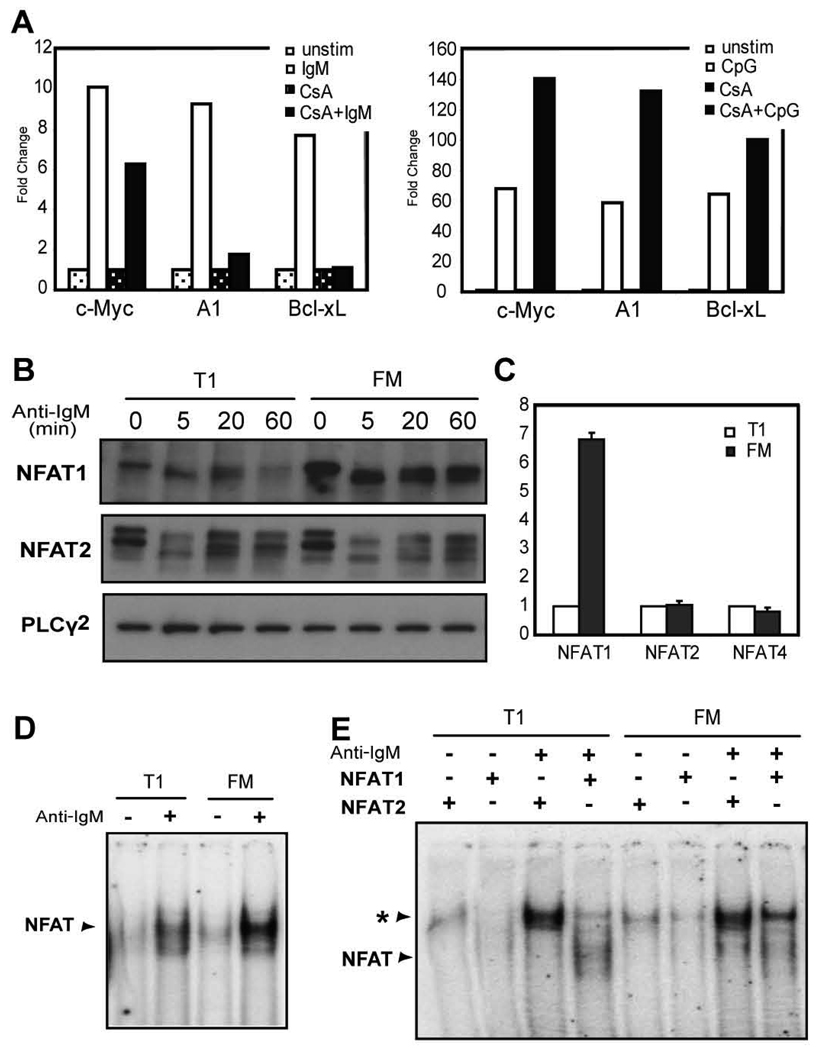
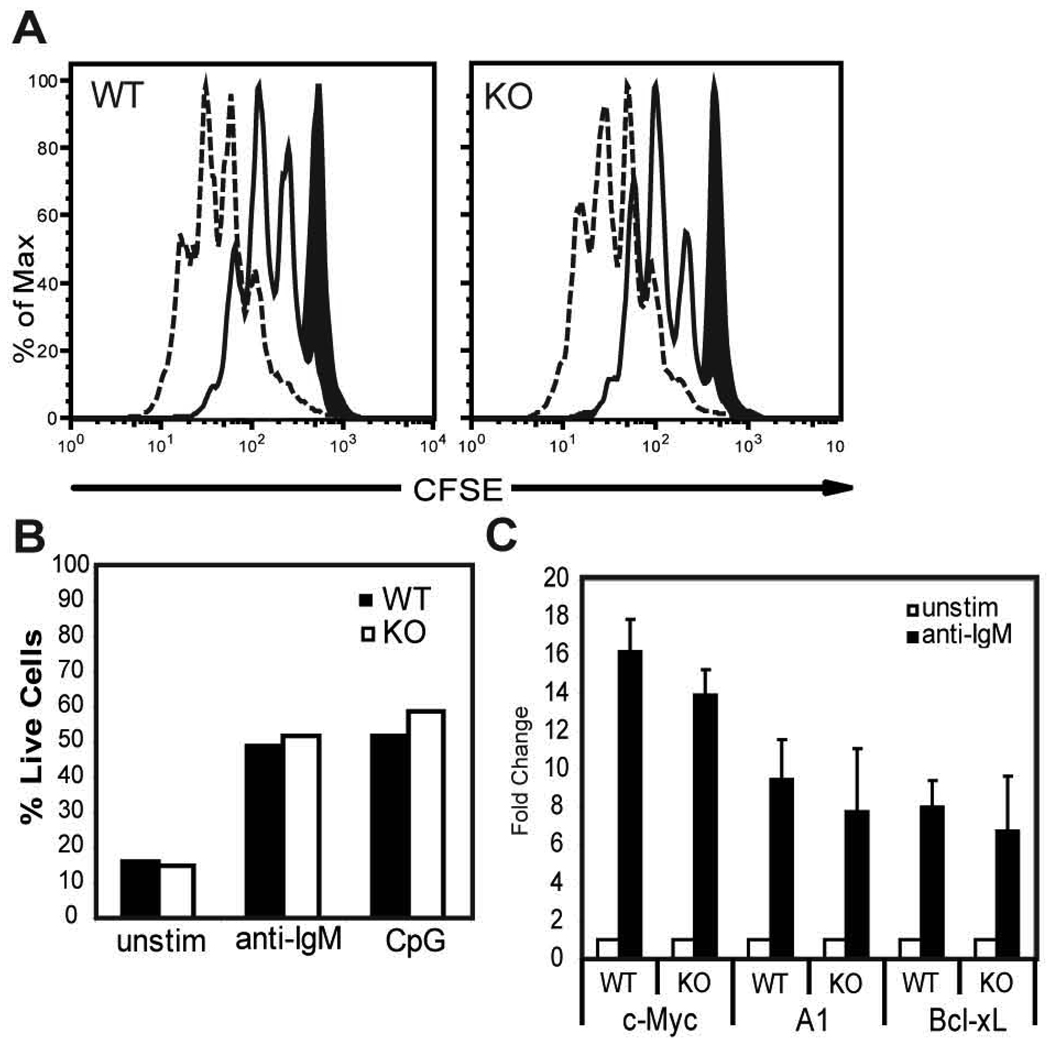
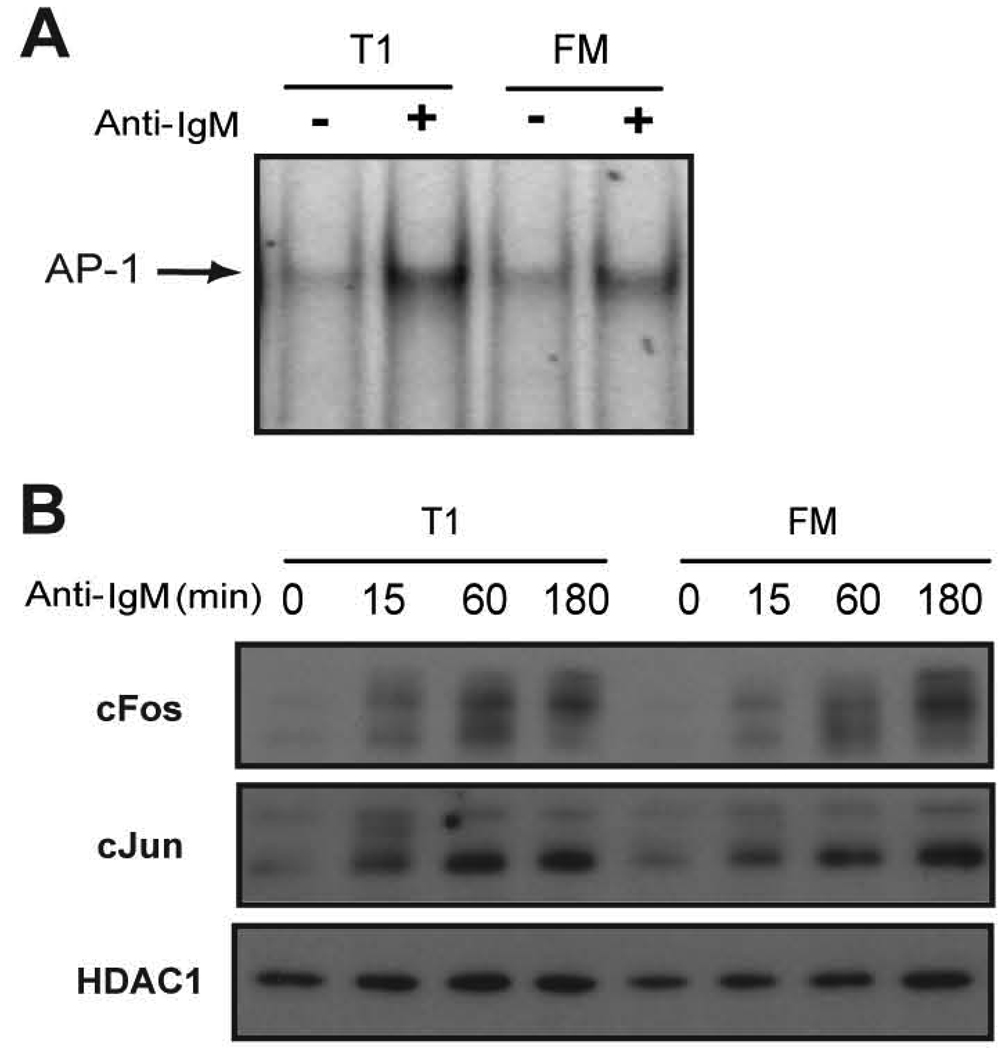
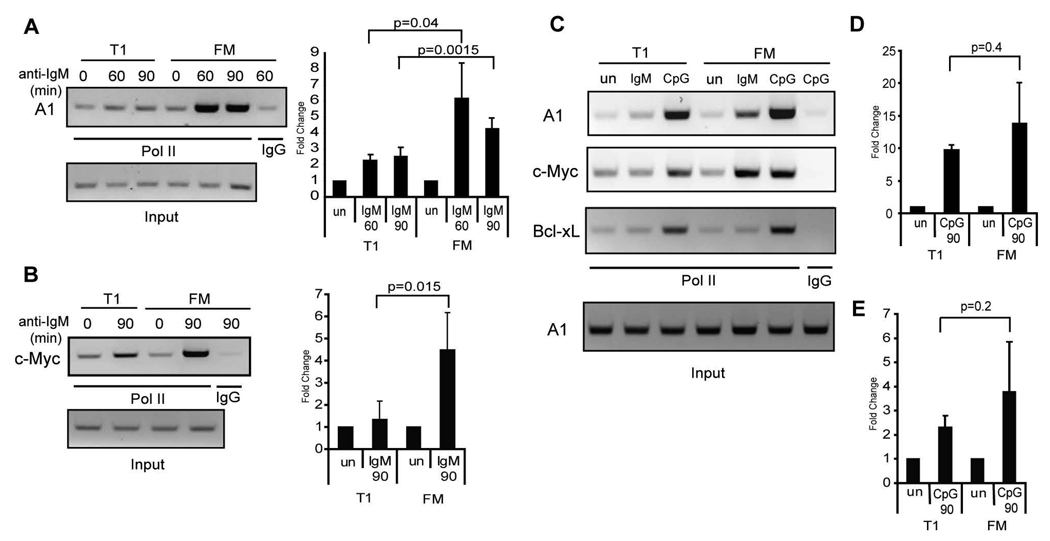
The signaling programs that enforce negative selection in early transitional (T1) B cells in response to BCR engagement remain poorly defined. We conducted a comprehensive comparison of BCR signaling in T1 vs follicular mature splenic B cells. T1, in contrast to follicular mature B cells, failed to express key NF-kappaB target genes in response to BCR engagement and exhibited a striking defect in assembly of an active transcriptional complex at the promoter of the survival and proliferative genes A1 and c-Myc. Surprisingly, and contrary to previous models, classical protein kinase C and IkappaB kinase activation, NF-kappaB nuclear translocation and DNA binding were intact in T1 B cells. Furthermore, despite a marked reduction in NFAT1 expression, differential NFAT or AP-1 activation cannot explain this transcriptional defect. Our combined findings demonstrate that T1 B cells are programmed for signal- and stage-specific "nuclear nonresponsiveness" upon encounter with self-Ags.


Figures

Figure 1
Figure 1
Transcriptional responses of T1 vs. FM B cells to anti-IgM and CpG. A, Caspase 3 activity in WT vs. Bim KO B cells. T1 and FM B cells from WT (left panel) and Bim KO (right panel) mice were stimulated with or without anti-IgM for the indicated time. Shown is the percentage of cells within the live gate expressing the active form of caspase-3. B–D, Transcription of NF-κB target genes after stimulating with anti-IgM. B, WT cells were stimulated for 3 h or C, for 30, 60, 90 min. D, Bim KO cells were stimulated for 12–15 h. E, Proliferative response based on dilution of CFSE in sorted cells after culture with (black solid lines) or without (gray dashed lines) anti-IgM for 48hrs. Numbers represent the percent live cells based on 7AAD staining with (black) or without (gray) anti-IgM. F, Expression of NF-κB target genes in WT T1 B cells after stimulation for 3 h with anti-IgM or CpG. All gene expression data are shown as fold change in transcript levels with unstimulated cells set as 1.
Figure 2
Figure 2
sIgM expression and anti-IgM responses of T1 and FM B cells from Hel-Ig Tg and WT mice and effect of cell surface antibodies on BCR staining. A, FACS analysis of surface IgM levels of T1 and FM B cells gated based on expression of cell surface markers CD24, CD21 from WT (left panel) and MD4 Hel-Ig Tg (right panel) B cells. B, Proliferative response following anti-IgM stimulation of sorted T1 and FM B cells from WT or Tg mice. C, Fold increase in transcript levels with anti-IgM stimulation (3 h) compared to unstimulated cells from purified WT or Hel-Ig Tg B cells subsets. Mean data with standard deviation (SD) from 5 experiments. D, Total B cells were stained with: anti-CD24, anti-CD21, anti-IgM Fab fragment, all three antibodies, or no antibody and then stimulated with anti-IgM F(ab)2 for 10 min. Whole cell lysates were blotted with anti-pY to measure activation and PLCγ2 to show equal loading. E, Total B cells were stained with anti-CD24, anti-CD21 and anti-IgM Fab fragment (prestained) or with no antibodies (unstained) and stimulated with anti-IgM as in D for the indicated time points. Whole cell lysates were probed with antibodies recognizing: p-JNK1/2, p-PKD and p-AKT. The blot was then stripped and reprobed with anti-JNK1, PKD and AKT antibodies as loading controls.
Figure 3
Figure 3
Activation status of proximal signaling molecules in sorted T1 and FM B cells upon anti-IgM stimulation. Whole cell lysates from stimulated and unstimulated cells were probed with antibodies that recognize: A, total pY B, phosphorylation of AKT at S473 C, phosphorylation of S6 D, phosphorylation of ERK1/2, p38 or JNK1/2 (short time points) or E, ERK1/2 and p38 (longer time points). Blots were stripped and reprobed with anti-PLCγ2, anti-AKT or anti-ERK1/2 to evaluate protein loading. Data shown are representative of at least 3 independent experiments.
Figure 4
Figure 4
PLCγ2 enzymatic activity is sufficient for downstream signaling events in T1 B cells. A, Activation of PLCγ2 and PKD. Sorted cells were stimulated with anti-IgM and whole cell lysates probed with antibodies recognizing phosphorylation of PLCγ2 at Y759 or PKD at the PKC trans-phosphorylation sites. Blots were stripped and reprobed with anti-PLCγ2 and anti-PKD to assess protein loading. B, Evaluation of calcium flux. Total splenic B cells were loaded with indo-1 and surface stained with CD21 and CD24 to identify T1 and FM B cell subsets. After acquiring a baseline for 30 seconds, anti-IgM was added as indicated. Ca2+ flux was measured in media containing 1.3mM Ca2+ with (top panel) or without the addition of excess levels of EGTA (bottom panel). C, Activation of cPKCs in T1 and FM B cells. Sorted cells were stimulated with anti-IgM and whole cell lysates probed with an antibody that recognizes phosphorylated serine residues preferentially phosphorylated by cPKCs. The blot was stripped and reprobed with anti-PLCγ2 to assess protein loading. All blots are representative of at least 3 independent experiments.
Figure 5
Figure 5
Activation of the NF-κB signaling cascade in T1 and FM B cells. A, Sorted cells were stimulated with anti-IgM for the indicated times and whole cell lysates were probed with antibodies recognizing phosphorylation of IKKα/β, IκBα and p65. Blots were then stripped and reprobed with anti-IKKα/β, anti-IκBα and anti-p65 to assess protein loading. B, Nuclear import of NF-κB subunits. Cytoplasmic and nuclear extracts were isolated at the times indicated from sorted subsets following anti-IgM stimulation and probed with antibodies specific for c-Rel, p65 and IκBα. PLCγ2 and HDAC1 protein levels are shown as loading controls for the cytoplasmic and nuclear fractions, respectively. C, DNA-binding of NF-IκB subunits. An EMSA was performed using a radiolabeled probe containing a κB binding site and nuclear extracts from sorted WT cells incubated with or without anti-IgM for 3 h. D, Specific p65 or cRel binding was measured by supershift assay. Blots and EMSA are representative of at least 3 independent experiments.
Figure 6
Figure 6
Expression and activation of NFAT family members in T1 and FM B cells. A, Sorted FM B cells were stimulated with anti-IgM (left panel) or CpG (right panel) with or without 2µM CsA for 3 h. Gene transcript levels were determined and shown as relative fold increase with anti-IgM stimulation relative to unstimulated cells; or cells treated with CsA alone. Representative of 4 independent experiments. B, NFAT1 and NFAT2 activation and protein levels. Whole cell lysates from unstimulated, or anti-IgM stimulated, sorted B cell subsets were probed with an antibody recognizing NFAT1 or NFAT2. PLCγ2 protein levels are shown as a loading control. C, NFAT family member transcript levels. mRNA levels of NFAT family members were determined by real-time PCR from sorted, unstimulated B cell subsets. Shown is the fold change between subsets where transcript levels in T1 B cells were set as 1. Mean with SD from 3 experiments. D, DNA binding of NFAT proteins. Sorted WT cells were incubated with or without anti-IgM for 3 h and an EMSA was performed with nuclear extracts using a radiolabeled probe containing the A1 promoter NFAT binding site. E, Specific binding of NFAT1 or NFAT2 was determined by supershift assay. The asterisk indicates supershifted complex. Representative of 3 independent experiments.
Figure 7
Figure 7
NFAT1 ko B cells exhibit intact transcriptional and functional responses to BCR engagement. A, FM B cells were FACS-sorted from WT or NFAT1 KO mice, labeled with CFSE and incubated for 72 h with no stimulus (black filled in), anti-IgM (solid line), or CpG (dashed line). B, Graph representing percent live cells under each condition based on incorporation of 7AAD. Representative of two independent experiments. C, Fold increase in transcript levels at 3 h following activation with anti-IgM compared to unstimulated cells from purified WT or KO FM B cells. Mean data with SD from 3 experiments.
Figure 8
Figure 8
Activation of AP-1 in T1 and FM B cells. A, DNA binding of AP-1. Sorted WT cells were incubated with or without anti-IgM for 2 h and an EMSA was performed with nuclear extracts using a radiolabeled probe containing an AP-1 binding site. B, Nuclear expression of cJun and cFos. Sorted T1 and FM B cells were stimulated with anti-IgM for the indicated times and nuclear extracts were probed for antibodies specific to cJun and cFos. HDAC1 levels are also shown as a loading control.
Figure 9
Figure 9
Deficient transcriptional activation at the A1 and c-Myc promoter in T1 B cells upon BCR crosslinking. A–B, Chromatin from WT T1 and FM B cells stimulated 60 or 90 min with anti-IgM was immunoprecipitated with antibodies that recognize Pol II or polyclonal rabbit IgG as a control. PCR was performed on DNA isolated from immunoprecipitates or 5% of input DNA (loading control) to amplify a DNA region within the A, A1 promoter, or B, c-Myc promoter. Shown is a representative figure of 3 independent experiments (left panel) and mean with SD of the fold increase in PCR product over unstimulated cells (right panel). C–E, Chromatin from WT T1 and FM B cells stimulated 90 min with anti-IgM or CpG was immunoprecipitated as above and PCR was performed as indicated. C, Representative figure of 4 independent experiments. D–E, Mean with SD of the fold increase in PCR product over unstimulated cells obtained using primers recognizing the D, A1 promoter, or E, c-Myc promoter.

References

    1. Hardy RR, Hayakawa K. B cell development pathways. Annu Rev Immunol. 2001;19:595–621. - PubMed
    1. Shlomchik MJ. Sites and stages of autoreactive B cell activation and regulation. Immunity. 2008;28:18–28. - PubMed
    1. Hippen KL, Schram BR, Tze LE, Pape KA, Jenkins MK, Behrens TW. In vivo assessment of the relative contributions of deletion, anergy, and editing to B cell self-tolerance. J Immunol. 2005;175:909–916. - PubMed
    1. Wardemann H, Yurasov S, Schaefer A, Young JW, Meffre E, Nussenzweig MC. Predominant autoantibody production by early human B cell precursors. Science. 2003;301:1374–1377. - PubMed
    1. Russell DM, Dembic Z, Morahan G, Miller JF, Burki K, Nemazee D. Peripheral deletion of self-reactive B cells. Nature. 1991;354:308–311. - PMC - PubMed

Publication types

MeSH terms

Substances