. 2009 Mar 1;182(5):2929-38.
doi: 10.4049/jimmunol.0803827.

Analysis of adhesion molecules, target cells, and role of IL-2 in human FOXP3+ regulatory T cell suppressor function

Affiliations

Analysis of adhesion molecules, target cells, and role of IL-2 in human FOXP3+ regulatory T cell suppressor function

Dat Q Tran et al. J Immunol. .

Abstract

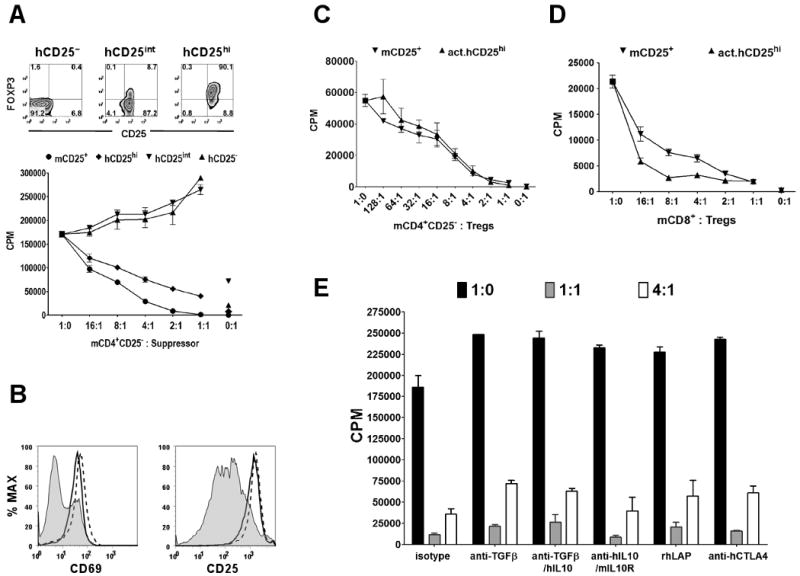
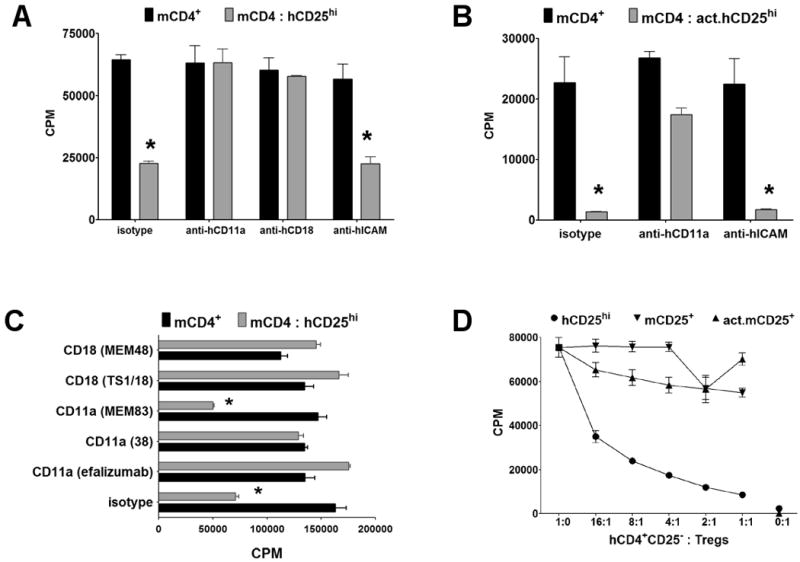
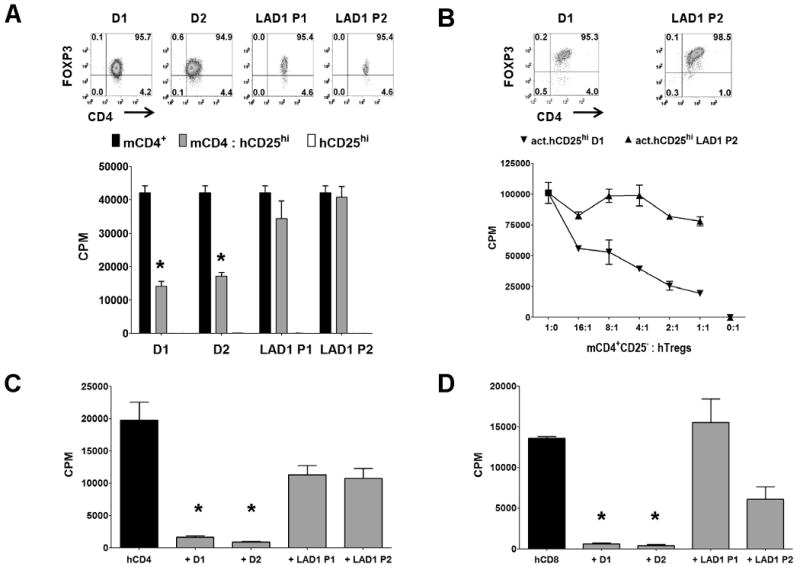
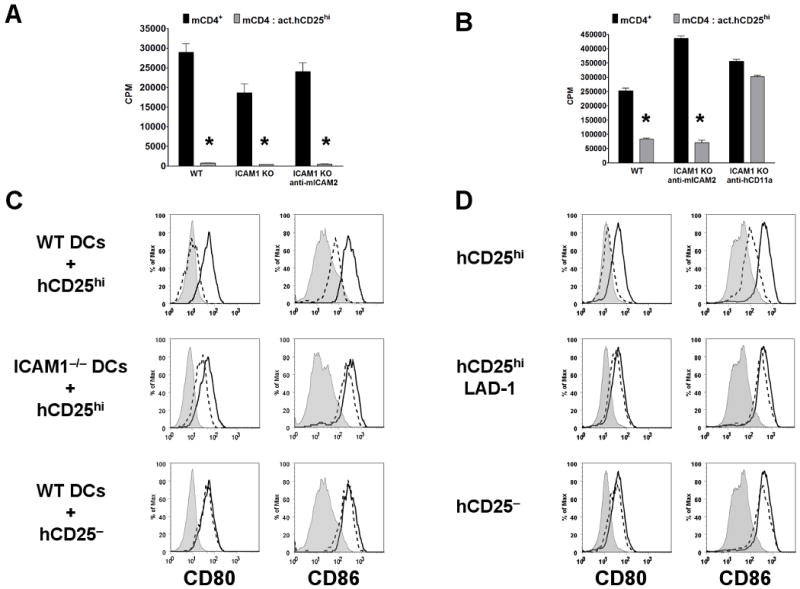
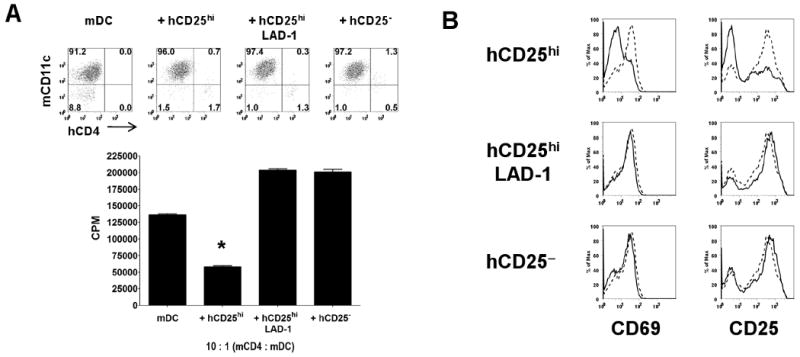
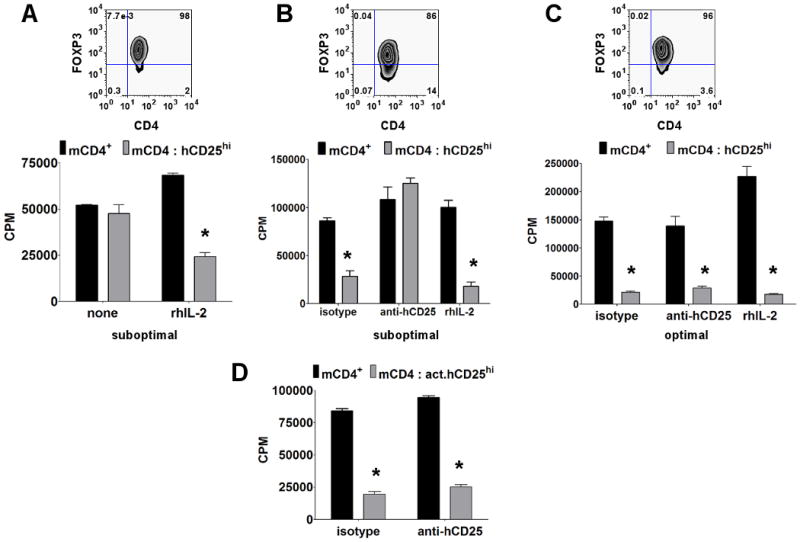
FOXP3(+) regulatory T cells (Tregs) are central to the maintenance of self-tolerance and immune homeostasis. The mechanisms of action and cellular targets for Treg-mediated suppression remain controversial. The critical adhesion molecules utilized by Tregs for the interaction with their target cells have not been well characterized. We show that human CD4(+)FOXP3(+)CD25(high) cells (hTregs) suppress the activation of mouse responders as efficiently as mouse Tregs. LFA-1 (CD11a/CD18) on the hTregs is critical for their suppressor function, since suppression can be reversed with blocking anti-hCD11a or anti-hCD18 mAb. Tregs from patients with LFA-1 deficiency fail to suppress human and mouse responders. Mouse CD4(+) T cells deficient in ICAM-1 can be suppressed by hTregs, indicating that the hTregs target mouse dendritic cells (DCs) through the binding of human LFA-1 to mouse ICAM-1. Coculture of mouse DCs with hTregs, but not hTregs from LFA-1-deficient patients, prevented the up-regulation of CD80/CD86 on the DCs and their capacity to activate responder T cells. Lastly, IL-2 is not required for hTreg suppressor function under optimal stimulatory condition and IL-2 consumption plays no role in hTreg-mediated suppression. Taken together, one of the mechanisms of Treg-mediated suppression functions across species and mediates an LFA-1/ICAM-1-dependent interaction between Tregs and DCs.


Conflict of interest statement

Disclosures

The authors have no financial conflict of interest.

Figures

Figure 1
Figure 1
Human Treg suppression of mouse T cell activation and proliferation. A, In vitro suppression of CD4+CD25 T cells from BALB/c mice with FACS-sorted human CD4+CD127 CD25hi (hCD25hi), hCD25int, hCD25 or mouse mCD25+ T cells. In the assay, the mouse CD25 and CD25+ were activated with mouse APCs and soluble anti-mCD3, while the human cells were activated with plate-bound anti-hCD3 (5 μg/ml) and anti-hCD28 (2.5 μg/ml) in the cocultures. Top panel represents post-sort level of FOXP3 and CD25 in the three human T cell populations. B, Expression of CD69 and CD25 on mouse CD4+CD25 T cells cocultured for 3 days at 1:1 ratio with hCD25 (solid line histogram), hCD25int (dashed line histogram), and hCD25hi (shaded histogram). C. In vitro suppression of mouse, CD4+CD25 or D, CD8+CD25 T cells activated with mouse APCs and soluble anti-mCD3 alone or with fresh mouse Tregs (mCD25+) or pre-activated human Tregs (act.hCD25hi) without restimulation. E, In vitro suppression of mouse CD4+CD25 T cells with pre-activated human Tregs at 1:0, 1:1 and 4:1 ratios of mouse responder to hTreg in the presence of isotype control or neutralizing mAbs to TGFβ (anti-TGFβ), human IL-10 (anti-hIL10), mouse IL-10 receptor (mIL10R), and human CTLA-4 (anti-hCTLA4). Recombinant human latency associated peptide (rhLAP) also was used to neutralize TGFβ. Data are representative of three independent experiments.
Figure 2
Figure 2
LFA-1 on human Tregs is essential for cell-contact mediated suppression. A, Proliferation of mouse CD4+CD25 T cells alone (black bar), or with a 1:1 ratio of fresh hTregs (hCD25hi, gray bar) or B, pre-activated hTregs (act.hCD25hi) in the presence of isotype control or anti-hCD11a (efalizumab), -hCD18 (TS1/18), or -hICAM-1/2/3 blocking mAbs. C, Proliferation of mouse CD4+CD25 T cells alone (black bar), or with a 1:1 ratio of fresh hTregs (hCD25hi, gray bar) in the presence of isotype control or different clones of anti-hCD11a or -hCD18 mAbs. For the above assays, the mouse responders were stimulated with mouse APCs and soluble anti-mCD3 while the fresh hTregs were optimally activated in the cocultures with plate-bound anti-hCD3/CD28. The pre-activated hTregs were not restimulated. D, Suppression of human CD4+CD25 T cells with FACS-sorted hTregs (hCD25hi), mTregs (mCD25+), or pre-activated mTregs (act.mCD25+). In this assay, the human responders and Tregs were stimulated with human APCs and soluble anti-hCD3, while the fresh mTregs were optimally activated in the cocultures with plate-bound anti-mCD3/CD28. The pre-activated mTregs were not restimulated. Data are representative of three independent experiments. Asterisk (*) represents p < 0.05 for the difference between the black and gray bars in each group.
Figure 3
Figure 3
Human Tregs from LAD-1 patients lack suppressive function. A, Proliferation of mouse CD4+CD25 T cells alone (black bar), with 1:1 ratio of fresh hTregs (hCD25hi, gray bar) from healthy donors (D1/D2), or LAD-1 patients (P1/P2). White bar is the hTregs stimulated alone. Upper panel represents post-sort flow cytometric FOXP3 staining on the hTregs. Asterisk (*) represents p < 0.05 for the difference between the black and gray bars in each group. B, Proliferation of mouse CD4+CD25 T cells alone, or cultured with varying numbers of pre-activated hTregs (act.hCD25hi) from healthy donor D1, or LAD-1 patient P1. Upper panel represents FOXP3 staining of 48 h pre-activated hTregs. In these assays, the mouse responders were stimulated with mouse APCs and soluble anti-mCD3 while the fresh hTregs were optimally activated with plate-bound anti-hCD3/CD28. The pre-activated hTregs were not restimulated. C, Proliferation of CD4+CD25 or D, CD8+CD25 T cells from a normal donor alone (black bar) or with 1:1 ratio of fresh hTregs (gray bar) from healthy donors (D1/D2), or LAD-1 patients (P1/P2). In this assay, the human responders and Tregs were stimulated with human APCs and soluble anti-hCD3. Data are representative of two independent experiments. Asterisk (*) represents p < 0.05 for the differences in suppression between healthy donors and LAD-1 patients.
Figure 4
Figure 4
Human Tregs target mouse DCs and not T cells via an LFA-1/ICAM-1 dependent interaction. A, Proliferation of CD4+CD25 T cells from wild-type (WT) C57BL/6 or ICAM-1−/− (KO) mice stimulated with soluble anti-mCD3 and T-depleted splenocytes or B, splenic DCs alone (black bar) or cocultured with 1:1 ratio of pre-activated hTregs (act.hCD25hi, gray bar) with or without blocking anti-mICAM-2 or -hCD11a (efalizumab) mAbs. The pre-activated hTregs were not restimulated. Asterisk (*) represents p < 0.05 for the difference between the black and gray bars in each group. C, Level of CD80/CD86 expression on splenic DCs from wild-type (WT) C57BL/6 or ICAM-1−/− mice at 0 h (shaded histogram) and after 18 h cultured alone (opened histogram) or with pre-activated human (dashed histogram) hCD25hi or hCD25 T cells from healthy donor. D, CD80/CD86 expression on splenic DCs from wild-type (WT) C57BL/6 mice at 0 h (shaded histogram) and after 18 h cultured alone (opened histogram) or with pre-activated human (dashed histogram) hCD25hi from healthy donor, hCD25hi from LAD-1 patient or hCD25 T cells from healthy donor. Data are representative of three (A, B and C) and two (D) independent experiments.
Figure 5
Figure 5
Human Tregs modulate splenic DCs to have decreased capacity to present antigen and activate mouse responder T cells. A, Proliferation of mouse CD4+CD25 T cells from HA-TCR Tg mice in the presence of HA peptide and re-isolated splenic DCs that had been previously cultured for 18 h alone (mDC), with Tregs from healthy donor (hCD25hi), with Tregs from LAD-1 patient (hCD25hi LAD-1), or with CD4+CD25 T cells from healthy donor (hCD25). Upper panel represents the purity of splenic DCs repurified from the cocultures based on staining with mouse CD11c and human CD4. B, Expression of CD69 and CD25 on mouse CD4+CD25 from the cocultures stimulated with splenic DCs that had been cultured for 18 h alone (dashed histogram) or with the three human T cell populations (solid histograms). Data are representative of two independent experiments. Asterisk (*) represents p < 0.05 for the differences in suppression between mDCs from hCD25hi vs. mDCs from hCD25hi LAD-1 or hCD25.
Figure 6
Figure 6
IL-2 is required for Treg suppressor function under suboptimal stimulatory conditions, but IL-2 consumption plays no role in hTreg-mediated suppression. A, Proliferation of mouse CD4+CD25 T cells alone (black bar) or with 1:1 ratio of fresh > 95% FOXP3+ hTregs (hCD25hi, gray bar) in the absence (none) or presence of 0.5 U/ml of recombinant human IL-2 (rhIL-2) under suboptimal stimulatory condition for hTregs. B, Proliferation of mouse CD4+CD25 T cells alone (black bar) or with 1:1 ratio of fresh < 90% FOXP3+ hTregs (hCD25hi, gray bar) in the presence of isotype control, daclizumab (anti-hCD25) or 0.5 U/ml of human IL-2 under suboptimal stimulatory condition. C, Proliferation of mouse CD4+CD25 T cells alone (black bar) or with 1:1 ratio of fresh > 95% FOXP3+ hTregs (hCD25hi, gray bar) in the presence of isotype, daclizumab or 0.5 U/ml of rhIL-2 under optimal stimulatory condition. Top panel represents post-sort FOXP3 purity for hTregs. D, Proliferation of mouse CD4+CD25 T cells alone (black bar) or with 1:1 ratio of pre-activated hTregs (act.hCD25hi, gray bar) in the presence of isotype or daclizumab (anti-hCD25). In these assays, the mouse responders were stimulated with mouse APCs and soluble anti-mCD3, while the fresh hTregs were stimulated either under suboptimal (3 μg/ml anti-hCD3 and 1 μg/ml anti-hCD28 plate-bound mAbs) or optimal stimulatory condition (5 μg/ml anti-hCD3 and 2.5 μg/ml anti-hCD28 plate-bound mAbs) in the cocultures. The pre-activated hTregs were not restimulated in the cocultures. Data are representative of three independent experiments. Asterisk (*) represents p < 0.05 for the difference between the black and gray bars in each group.

References

    1. Shevach EM, DiPaolo RA, Andersson J, Zhao DM, Stephens GL, Thornton AM. The lifestyle of naturally occurring CD4+ CD25+ Foxp3+ regulatory T cells. Immunol Rev. 2006;212:60–73. - PubMed
    1. Sakaguchi S, Ono M, Setoguchi R, Yagi H, Hori S, Fehervari Z, Shimizu J, Takahashi T, Nomura T. Foxp3+ CD25+ CD4+ natural regulatory T cells in dominant self-tolerance and autoimmune disease. Immunol Rev. 2006;212:8–27. - PubMed
    1. Shevach EM. From vanilla to 28 flavors: multiple varieties of T regulatory cells. Immunity. 2006;25:195–201. - PubMed
    1. Tang Q, Bluestone JA. The Foxp3+ regulatory T cell: a jack of all trades, master of regulation. Nat Immunol. 2008;9:239–244. - PMC - PubMed
    1. Thornton AM, Shevach EM. CD4+CD25+ immunoregulatory T cells suppress polyclonal T cell activation in vitro by inhibiting interleukin 2 production. J Exp Med. 1998;188:287–296. - PMC - PubMed

Publication types

MeSH terms

Substances