Comparative Study
. 2009 Mar 1;182(5):3032-8.
doi: 10.4049/jimmunol.0803402.

Selective priming and expansion of antigen-specific Foxp3- CD4+ T cells during Listeria monocytogenes infection

Affiliations
Comparative Study

Selective priming and expansion of antigen-specific Foxp3- CD4+ T cells during Listeria monocytogenes infection

James M Ertelt et al. J Immunol. .

Abstract

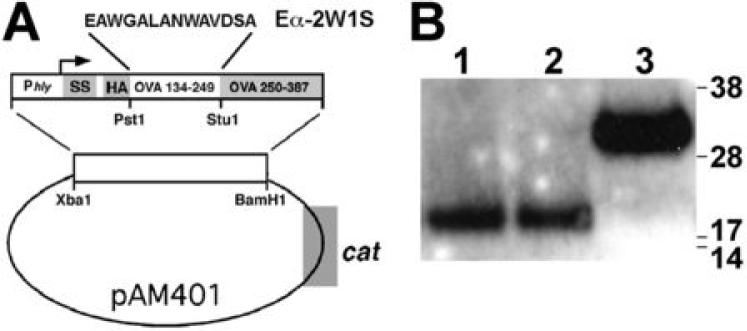
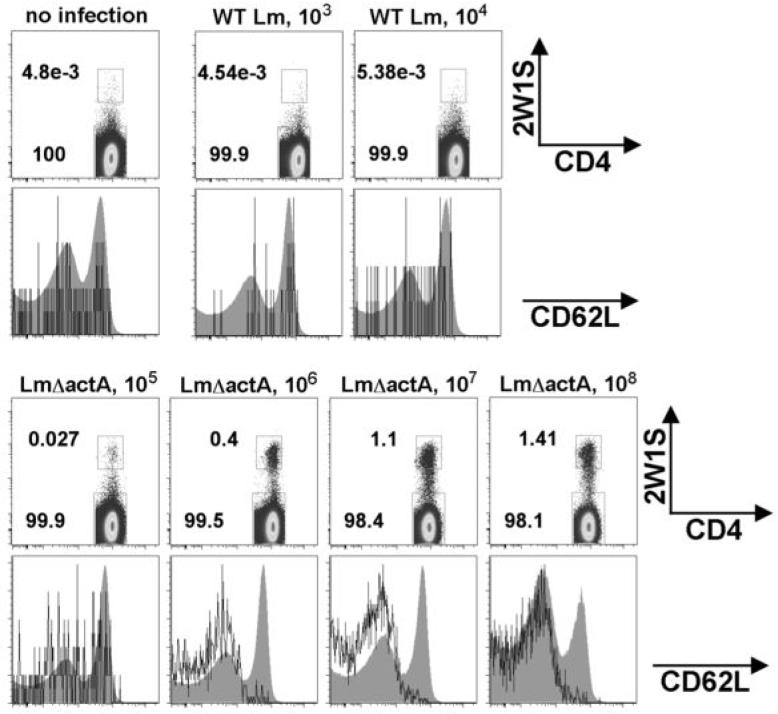
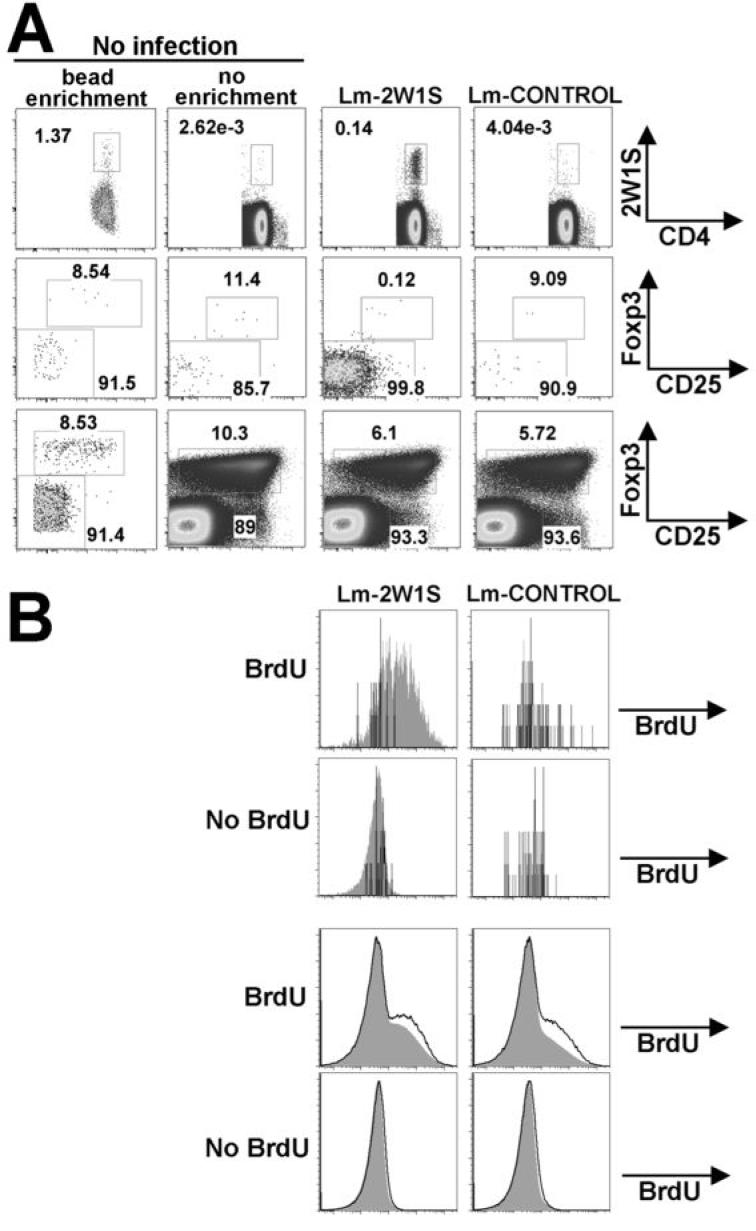
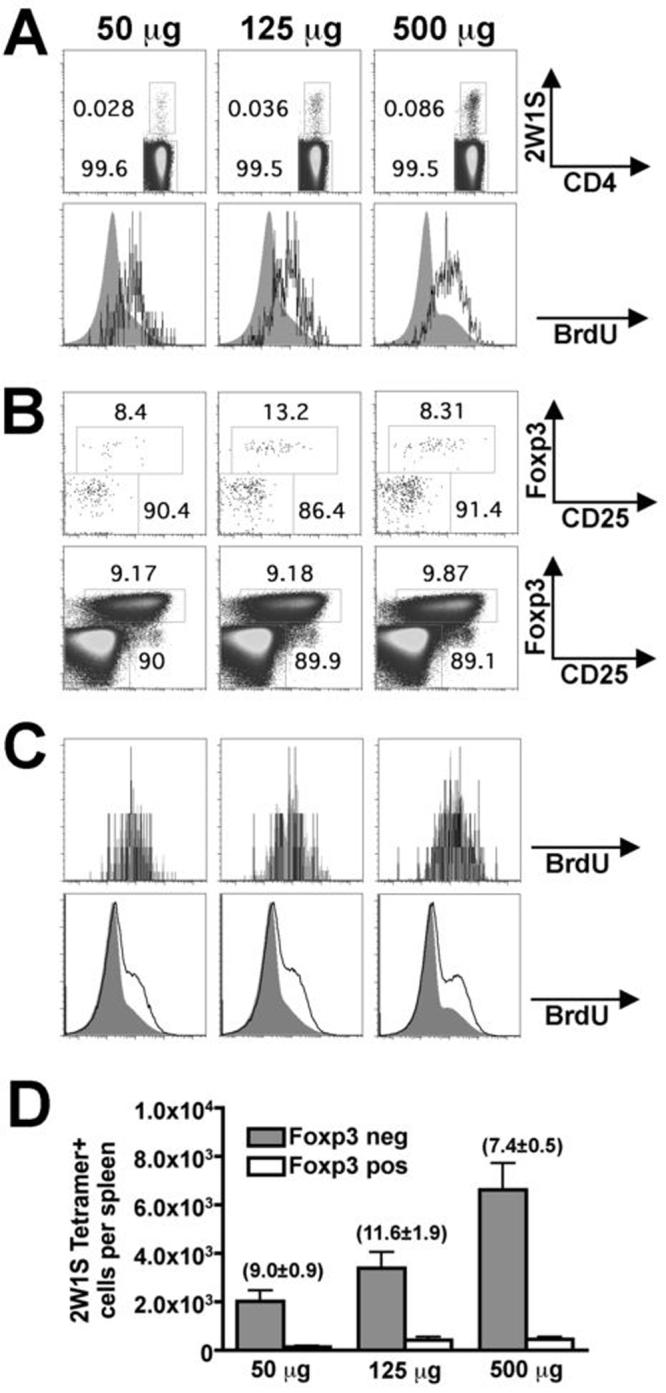
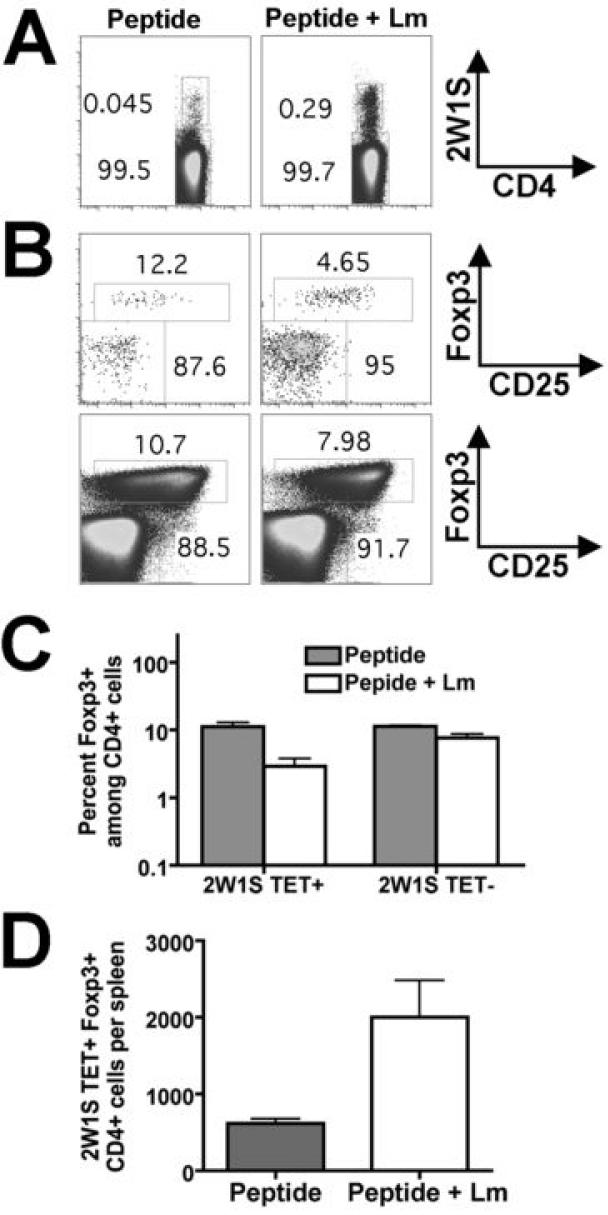
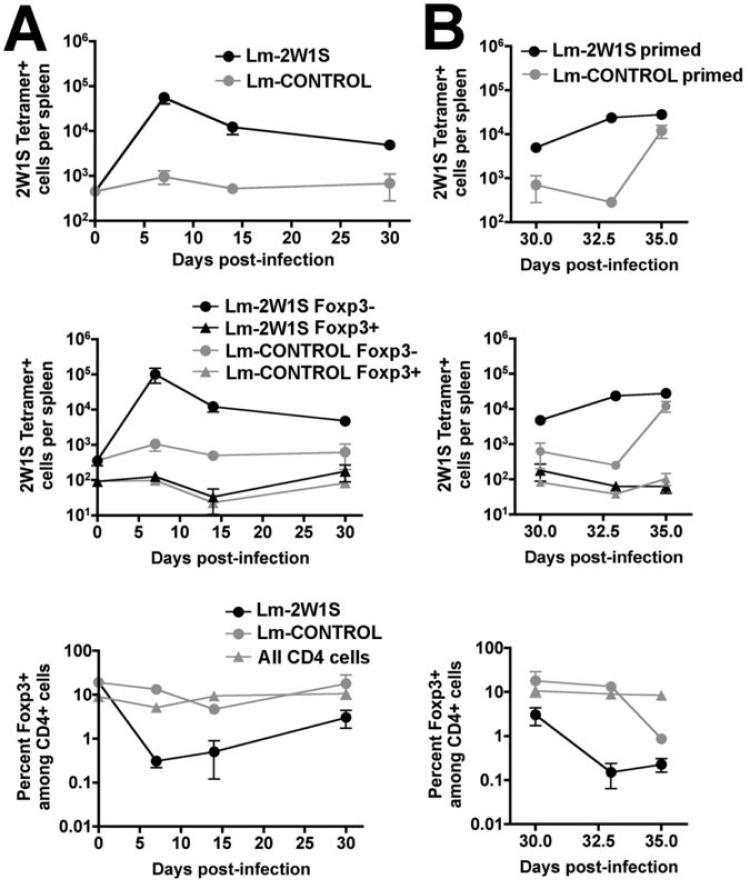
The Foxp3-expressing subset of regulatory CD4(+) T cells have defined Ag specificity and play essential roles in maintaining peripheral tolerance by suppressing the activation of self-reactive T cells. Similarly, during chronic infection, pathogen-specific Foxp3-expressing CD4(+) T cells expand and actively suppress pathogen-specific effector T cells. Herein, we used MHC class II tetramers and Foxp3(gfp) knockin mice to track the kinetics and magnitude whereby pathogen-specific Foxp3(+)CD4(+) and Foxp3(-)CD4(+) cells are primed and expand after acute infection with recombinant Listeria monocytogenes (Lm) expressing the non-"self"-Ag 2W1S(52-68). We demonstrate that Lm infection selectively primes proliferation, expansion, and subsequent contraction of Lm-specific Foxp3(-) effector CD4(+) cells, while the numbers of Lm-specific Foxp3(+)CD4(+) regulatory cells remain essentially unchanged. In sharp contrast, purified 2W1S(52-68) peptide primes coordinated expansion of both Foxp3(+) regulatory and Foxp3(-) effector T cells with the same Ag specificity. Taken together, these results indicate selective priming and expansion of Foxp3(-) CD4 T cells is a distinguishing feature for acute bacterial infection.


Figures

FIGURE 1
FIGURE 1
A. Construct map indicating placement of coding sequences for 2W1S52-68 peptides expressed and secreted behind the hly promoter and signal sequence (SS) within the pAM401 parent vector (cat, chloroamphenicol acetyltransferase). B. Western blot of supernatant protein from WT Lm (WT Lm-2W1S, lane 1) or Lm ΔactA (Lm ΔactA-2W1S, lane 2) each transformed with this construct, and Lm-OVA (lane 3) used as a positive control (25).
FIGURE 2
FIGURE 2
Expansion of 2W1S-specific CD4 cells after WT Lm-2W1S or Lm ΔactA-2W1S infection. FACS plots indicating the percent 2W1S-TET+ cells among CD4+ cells before or seven days after infection with the indicated inocula of WT Lm 2W1S and Lm ΔactA-2W1S (top). Histogram plots (bottom) indicating CD62L expression among 2W1S-TET+CD4+ cells (solid line) and 2W1S-TET+CD4+ cells (filled shaded). These data are representative of four independent experiments each with similar results.
FIGURE 3
FIGURE 3
Lm-2W1S does not prime expansion of 2W1S-specific Foxp3+CD4+ cells. A. Representative FACS plots indicating the percent 2W1S-TET+CD4+ cells before or seven days after infection with either 106 CFUs of Lm ΔactA-2W1S (Lm-2W1S) or Lm ΔactA expressing an irrelevant antigen (Lm-CONTROL) (top). Percent Foxp3+ cells among 2W1S-TET+ cells (middle) and 2W1S-TET- (bottom) cells for the indicated mice. B. BrdU incorporation for Foxp3+ (line histogram) and Foxp3- cells (filled histogram) among 2W1S-TET+CD4+ cells (top) or tetramer negative CD4+ cells (bottom) in mice treated with either daily BrdU or no BrdU. These data are representative of three independent experiments each with similar results.
FIGURE 4
FIGURE 4
Expansion of 2W1S-specific Foxp3+ and Foxp3-CD4+ cells day seven after 2W1S52-68 peptide inoculation. A. Representative FACS plots indicating percent 2W1S-TET+CD4+ cells (top), and BrdU incorporation among 2W1S-TET+CD4+ cells (line histogram) or tetramer-negative CD4+ T cells (filled histogram) (bottom). B. FACS plots indicating percent Foxp3+ cells among 2W1S-TET+ (top) and tetramer-negative CD4+ cells (bottom). C. BrdU incorporation among Foxp3+ (line histogram) or Foxp3- cells (filled histogram) among 2W1S-TET+CD4+ cells (top) and tetramer-negative CD4+ T cells (bottom). D. Total numbers of 2W1S-TET+CD4+ Foxp3- and Foxp3+ cells among splenocytes at each peptide dose. Numbers indicate the mean (± standard error) percentage of Foxp3+ cells among 2W1S-TET+CD4+ cells. These data are combined from three independent experiments each with similar results containing 6-8 mice per group. Bar, one standared error.
FIGURE 5
FIGURE 5
Expansion of 2W1S-specific CD4+ cells after inoculation with 2W1S52-68 peptide (125 μg) alone (Peptide) or peptide co-administered with non-recombinant Lm (LmΔactA 106 CFUs) (Peptide + Lm). A. Representative FACS plots indicating percent 2W1S-TET+CD4+ cells among all CD4+ splenocytes for each condition day 7 after inoculation. B. FACS plots indicating percent Foxp3+ cells among 2W1S-TET+ (top) and tetramer-negative CD4+ cells (bottom) after inoculation with either peptide alone or peptide + Lm. C. Percent Foxp3+ cells among either 2W1S-tetramer positive or 2W1S-tetramer negative CD4+ cells for each condition. D. Total numbers of 2W1S-TET+CD4+ Foxp3+ cells per mouse spleen day 7 after inoculation with 2W1S52-68 peptide alone or peptide co-administered with non-recombinant Lm. These data are combined from three independent experiments each with similar results containing 5-6 mice per group. Bar, one standared error.
FIGURE 6
FIGURE 6
Kinetics of 2W1S-specific CD4 T cell expansion after primary (A) and secondary (B) Lm-2W1S infection. Total numbers of 2W1S-TET+CD4+ cells (top), total numbers of 2W1S-TET+Foxp3+ or 2W1S-TET+Foxp3- cells (middle), and percent Foxp3+ cells among 2W1S-TET+ or all CD4 cells (bottom), at the indicated time points after primary infection (A) with either Lm ΔactA-2W1S (Lm-2W1S) or Lm ΔactA expressing an irrelevant antigen (Lm-CONTROL) or secondary challenge with WT Lm-2W1S (B). The percentage of Foxp3+ cells among all CD4 T cells in the bottom panels reflect data for mice after Lm-2W1S infection, although similar percentages were obtained after Lm-CONTROL infection. These data are combined from four independent experiments each with similar results that together contain 8 - 12 mice per group per time point.

References

    1. Khattri R, Cox T, Yasayko SA, Ramsdell F. An essential role for Scurfin in CD4+CD25+ T regulatory cells. Nat Immunol. 2003;4:337–342. - PubMed
    1. Brunkow ME, Jeffery EW, Hjerrild KA, Paeper B, Clark LB, Yasayko SA, Wilkinson JE, Galas D, Ziegler SF, Ramsdell F. Disruption of a new forkhead/winged-helix protein, scurfin, results in the fatal lymphoproliferative disorder of the scurfy mouse. Nat Genet. 2001;27:68–73. - PubMed
    1. Thornton AM, Shevach EM. Suppressor effector function of CD4+CD25+ immunoregulatory T cells is antigen nonspecific. J Immunol. 2000;164:183–190. - PubMed
    1. Thornton AM, Shevach EM. CD4+CD25+ immunoregulatory T cells suppress polyclonal T cell activation in vitro by inhibiting interleukin 2 production. J Exp Med. 1998;188:287–296. - PMC - PubMed
    1. Hsieh CS, Zheng Y, Liang Y, Fontenot JD, Rudensky AY. An intersection between the self-reactive regulatory and nonregulatory T cell receptor repertoires. Nat Immunol. 2006;7:401–410. - PubMed

Publication types

MeSH terms

Substances