. 2009 Apr;8(4):331-6.
doi: 10.1038/nmat2398. Epub 2009 Feb 22.

Biodegradable luminescent porous silicon nanoparticles for in vivo applications

Affiliations

Biodegradable luminescent porous silicon nanoparticles for in vivo applications

Ji-Ho Park et al. Nat Mater. 2009 Apr.

Abstract

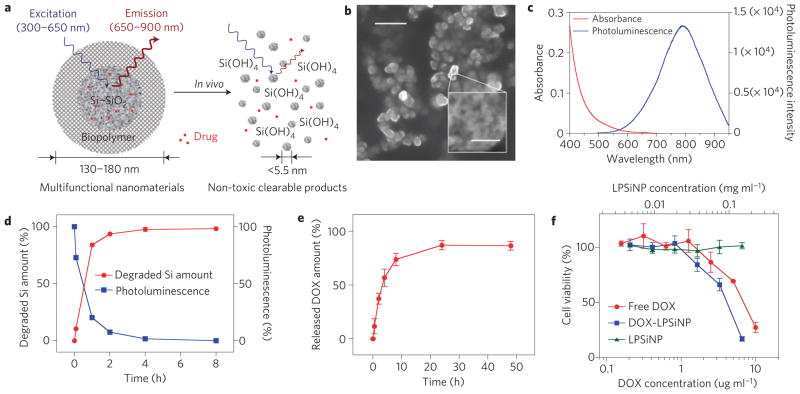
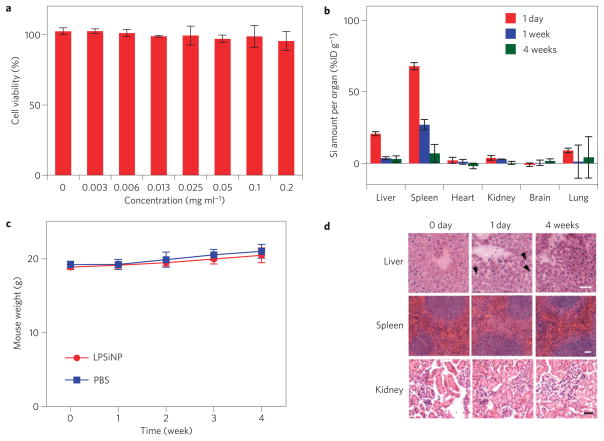
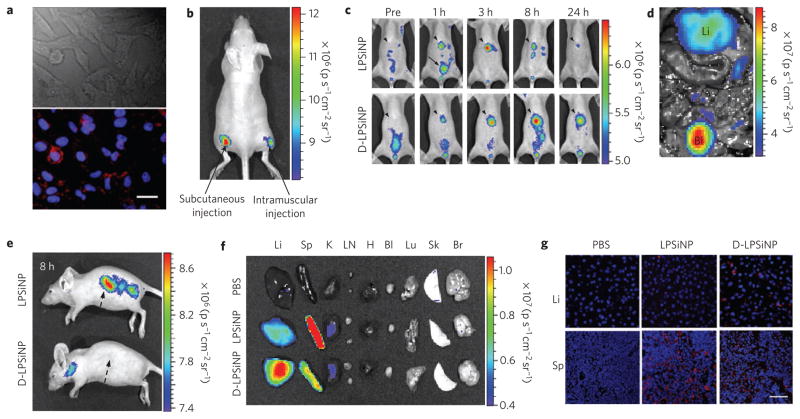
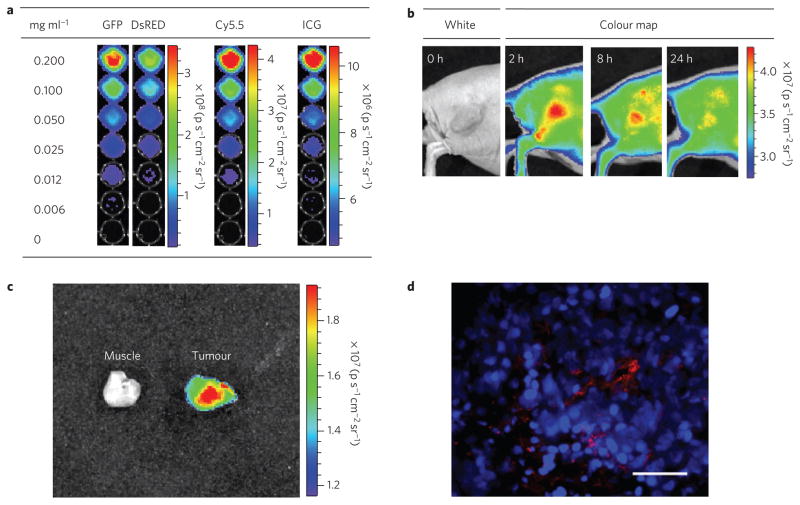
Nanomaterials that can circulate in the body hold great potential to diagnose and treat disease. For such applications, it is important that the nanomaterials be harmlessly eliminated from the body in a reasonable period of time after they carry out their diagnostic or therapeutic function. Despite efforts to improve their targeting efficiency, significant quantities of systemically administered nanomaterials are cleared by the mononuclear phagocytic system before finding their targets, increasing the likelihood of unintended acute or chronic toxicity. However, there has been little effort to engineer the self-destruction of errant nanoparticles into non-toxic, systemically eliminated products. Here, we present luminescent porous silicon nanoparticles (LPSiNPs) that can carry a drug payload and of which the intrinsic near-infrared photoluminescence enables monitoring of both accumulation and degradation in vivo. Furthermore, in contrast to most optically active nanomaterials (carbon nanotubes, gold nanoparticles and quantum dots), LPSiNPs self-destruct in a mouse model into renally cleared components in a relatively short period of time with no evidence of toxicity. As a preliminary in vivo application, we demonstrate tumour imaging using dextran-coated LPSiNPs (D-LPSiNPs). These results demonstrate a new type of multifunctional nanostructure with a low-toxicity degradation pathway for in vivo applications.


Figures

Figure 1
Figure 1. Characterization of LPSiNPs
a, Schematic diagram depicting the structure and in vivo degradation process for the (biopolymer-coated) nanoparticles used in this study. b, SEM image of LPSiNPs (the inset shows the porous nanostructure of one of the nanoparticles). The scale bar is 500nm (50nm for the inset). c, Photoluminescence emission and absorbance spectra of LPSiNPs. Photoluminescence is measured using ultraviolet excitation (λ=370 nm). d, Appearance of silicon in solution (by ICP-OES) and photoluminescence intensity (λex =370nm and λem = maximum peak intensity at each time point) from a sample of LPSiNPs (50 μg ml−1) incubated in PBS solution at 37 °C as a function of time. e, Release profile depicting per cent of DOX from DOX-LPSiNPs released into a PBS solution as a function of time at 37 °C. Data were obtained by filtering out DOX-LPSiNPs from the solution at each time point using a centrifugal filter and measuring the fluorescence intensity of free DOX left in solution (λem = 590nm, λex = 480 nm). f, Cytotoxicity of DOX-LPSiNPs, bare LPSiNPs and free DOX towards MDA-MB-435 human carcinoma cells, quantified by the MTT assay. The cells were incubated with the samples for 48 h. The error bars in d and f indicate s.d.
Figure 2
Figure 2. Biocompatibility and biodegradability of LPSiNPs
a, In vitro cytotoxicity of LPSiNP towards HeLa cells, determined by the calcein assay. LPSiNPs at the indicated concentrations were incubated with cells for 48 h. b, In vivo biodistribution and biodegradation of LPSiNPs over a period of 4 weeks in a mouse. Aliquots of LPSiNPs were intravenously injected into the mouse (n=3 or 4, dose=20 mg kg−1). The silicon concentration in the organs was determined at different time points after injection using ICP-OES. c, Change in body mass of mice injected with LPSiNPs (n=3, dose=20 mg kg−1) compared with PBS control (n=4). There is no statistically significant difference in the mass change between control (PBS) and LPSiNPs over a period of 4 weeks. The error bars in ac indicate s.d. d, Liver, spleen and kidney histology. Livers, spleens and kidneys were collected from mice before, 1 day and 4 weeks after intravenous injection of LPSiNPs (20 mg kg−1). Organs were stained with haematoxylin and eosin. The arrows indicate the LPSiNPs taken up by macrophages in the liver. The scale bar is 50 μm for all images.
Figure 3
Figure 3. In vitro, in vivo and ex vivo fluorescence imaging with LPSiNPs
a, In vitro cellular imaging with LPSiNPs. HeLa cells were treated with LPSiNPs for 2 h and then imaged. Red and blue indicate LPSiNPs and cell nuclei, respectively. The scale bar is 20 μm. b, In vivo fluorescence image of LPSiNPs (20 μl of 0.1 mg ml−1) injected subcutaneously and intramuscularly on each flank of a mouse. c, In vivo images of LPSiNPs and D-LPSiNPs. The mice were imaged at multiple time points after intravenous injection of LPSiNPs and D-LPSiNPs (20 mg kg−1). Arrowheads and arrows with solid lines indicate liver and bladder, respectively. d, In vivo image showing the clearance of a portion of the injected dose of LPSiNPs into the bladder, 1 h post-injection. Li and Bl indicate liver and bladder, respectively. e, Lateral image of the same mice shown in c, 8 h after LPSiNP or D-LPSiNP injection. Arrows with dashed lines indicate spleen. f, Fluorescence images showing the ex vivo biodistribution of LPSiNPs and D-LPSiNPs in a mouse. Organs were collected from the animals shown in c, 24 h after injection. Li, Sp, K, LN, H, Bl, Lu, Sk and Br indicate liver, spleen, kidney, lymph nodes, heart, bladder, lung, skin and brain, respectively. g, Fluorescence histology images of livers and spleens from the mice shown in c and f, 24 h after injection. Red and blue indicate (D-)LPSiNPs and cell nuclei, respectively. The scale bar is 50 μm for all images.
Figure 4
Figure 4. Fluorescence images of tumours containing D-LPSiNPs
a, Fluorescence images of D-LPSiNPs as a function of concentration using different excitation filters (GFP: 445–490nm and 1 s exposure time; Discosoma red fluorescent protein (DsRed): 500–550 nm, 2 s exposure time; Cy5.5: 615–665 nm, 8 s exposure time; ICG: 710–760 nm, 20 s exposure time). The emission filter used is ICG (810–875 nm). b, Representative fluorescence images of a mouse bearing an MDA-MB-435 tumour. The mouse was imaged using a Cy5.5 excitation filter and an ICG emission filter at the indicated times after intravenous injection of D-LPSiNPs (20 mg kg−1). Note that a strong signal from D-LPSiNPs is observed in the tumour, indicating significant passive accumulation in the tumour by the enhanced permeability and retention (EPR) effect. c, Ex vivo fluorescence images of tumour and muscle around the tumour from the mouse used in b. d, Fluorescence images of a tumour slice from the mouse in b. Red and blue indicate D-LPSiNPs and cell nuclei (DAPI stain), respectively. The scale bar is 100 μm.

Comment in

References

    1. Gao XH, Cui YY, Levenson RM, Chung LWK, Nie SM. In vivo cancer targeting and imaging with semiconductor quantum dots. Nature Biotech. 2004;22:969–976. - PubMed
    1. Torchilin VP. Recent advances with liposomes as pharmaceutical carriers. Nature Rev Drug Disc. 2005;4:145–160. - PubMed
    1. Lee JH, et al. Artificially engineered magnetic nanoparticles for ultra-sensitive molecular imaging. Nature Med. 2007;13:95–99. - PubMed
    1. Liu Z, et al. Circulation and long-term fate of functionalized, biocompatible single-walled carbon nanotubes in mice probed by Raman spectroscopy. Proc Natl Acad Sci USA. 2008;105:1410–1415. - PMC - PubMed
    1. Godefroo S, et al. Classification and control of the origin of photoluminescence from Si nanocrystals. Nature Nanotech. 2008;3:174–178. - PubMed

Publication types