. 2009 Mar;15(3):313-8.
doi: 10.1038/nm.1917. Epub 2009 Feb 22.

A point mutation in KINDLIN3 ablates activation of three integrin subfamilies in humans

Affiliations

A point mutation in KINDLIN3 ablates activation of three integrin subfamilies in humans

Nikolay L Malinin et al. Nat Med. 2009 Mar.

Abstract

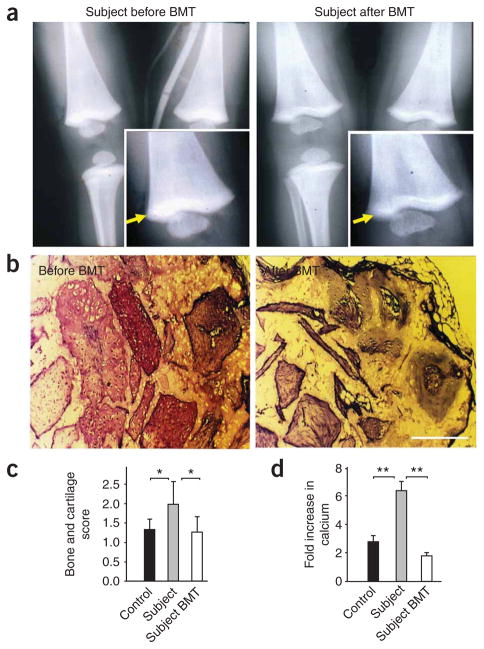
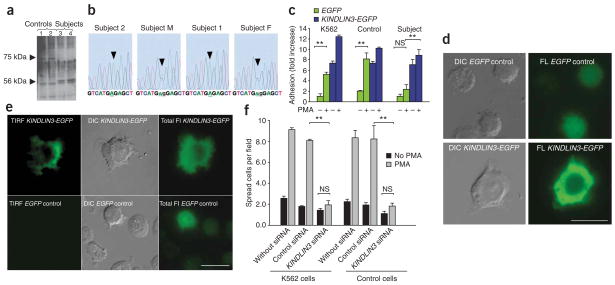
Monogenic deficiency diseases provide unique opportunities to define the contributions of individual molecules to human physiology and to identify pathologies arising from their dysfunction. Here we describe a deficiency disease in two human siblings that presented with severe bleeding, frequent infections and osteopetrosis at an early age. These symptoms are consistent with but more severe than those reported for people with leukocyte adhesion deficiency III (LAD-III). Mechanistically, these symptoms arose from an inability to activate the integrins expressed on hematopoietic cells, including platelets and leukocytes. Immortalized lymphocyte cell lines isolated from the two individuals showed integrin activation defects. Several proteins previously implicated in integrin activation, including Ras-associated protein-1 (RAP1) and calcium and diacylglycerol-regulated guanine nucleotide exchange factor-1 (CALDAG-GEF1), were present and functional in these cell lines. The genetic basis for this disease was traced to a point mutation in the coding region of the KINDLIN3 (official gene symbol FERMT3) gene. When wild-type KINDLIN-3 was expressed in the immortalized lymphocytes, their integrins became responsive to activation signals. These results identify a genetic disease that severely compromises the health of the affected individuals and establish an essential role of KINDLIN-3 in integrin activation in humans. Furthermore, allogeneic bone marrow transplantation was shown to alleviate the symptoms of the disease.


Figures

Figure 1
Figure 1
Analysis of platelet activation in subjects. (a) Aggregation curves of platelets from subject 1 stimulated by PMA (100 nM), ADP (10 μM) or thrombin (1 U ml−1). Aggregation of platelets from a healthy volunteer in response to ADP is shown for comparison. (b) Platelets from subject 2 and a healthy control were isolated as described in the Supplementary Methods, treated with 100 nM PMA (top) or 1 U ml−1 thrombin (bottom) and added to fibrinogen-coated cover slips for 30 min. Representative fluorescence images of adherent platelets stained with Texas Red–phalloidin (top) or antibody to β3 integrin labeled with FITC (bottom) are shown. Note the presence of platelet aggregates in control, but not in the subject 2’s sample. Scale bar, 10 μm. (c) Time curves of 125I-fibrinogen binding to platelets from subject 1 and control platelets in response to thrombin. Nonspecific binding was determined in the presence of a 50-fold excess of unlabeled fibrinogen (Supplementary Methods). (d) Integrin inside-out activation but not integrin expression was deficient in subjects’ platelets. Platelets were stimulated with 20 μM ADP, 1 U ml−1 thrombin or 100 nM PMA or were left unstimulated. For fibrinogen binding, FITC-labeled fibrinogen was added to the platelet suspension in the presence and absence of PMA, and the mean fluorescence intensity (MFI) was determined by FACS. Levels of PAC-1 binding, P-selectin, and αIIb and β3 integrin subunits on control and subjects’ platelets were also assessed by FACS analysis. β3 integrin data incorporate measurements for both subjects; the other data are from subject 1. The difference between subjects and control was not significant (NS). Fold increases over control (unstimulated control platelets) are shown. (The data represent means ± s.d., n = 3, **P < 0.01, *P < 0.05).
Figure 2
Figure 2
Impaired function of αMβ2, α4β1 and αVβ3 integrins on subjects’ cells. (a) Adhesion of neutrophils isolated from subject 1 and a healthy control to fibrinogen and denatured ovalbumin in the presence or absence of 200 nM PMA. Specificity of adhesion was determined in the presence of an excess of αMβ2 ligand, neutrophil inhibitory factor (NIF). Adhesion of control resting neutrophils to ovalbumin was assigned a value of 100%. Data shown represent means ± s.d. (n = 3, ** P < 0.01). (b,c) Subject 1’s lymphocytes and neutrophils did not aggregate upon stimulation. Normal and subject lymphocytes (b) and neutrophils (c) were stimulated with 0.16 μM PMA and 1 μM fMLP, respectively. Representative photographs of lymphocytes were taken 25 min after stimulation (b). Scale bar, 100 μm. Neutrophil aggregation was measured 10 min after stimulation (c). (Means ± s.d.; n = 3, ** P < 0.01). (d) Neutrophil oxidative burst was impaired in subject 1. Superoxide release from neutrophils stimulated with PMA or opsonized zymosan (OZ) particles was measured as described in the Supplementary Methods (data represent means ± s.d.; n = 3, ** P < 0.01, * P < 0.05). (e) Subject 1’s lymphocytes, unlike control cells, did not adhere to intercellular adhesion molecule-1 in response to PMA (n = 3, ** P < 0.01). (f) Expression of the β2 integrin activation epitope on subject 1’s (left) and control (right) lymphocytes. Cells were stimulated with PMA (solid line) and analyzed for binding of mAb 24 by FACS analysis. The dotted line represents staining with an isotype-matched control mAb. (g) Binding of activation-dependent ligand WOW-1 Fab to lymphocytes from subject 2 and control cells was measured by FACS analysis in the presence or absence of PMA (200 nM). The data represent means ± s.d., n = 3, ** P < 0.01. (h) Peripheral blood mononuclear cells were isolated from the blood of a healthy control, the two subjects and their parents and immortalized. Adhesion of immortalized cells to fibrinogen in the presence or absence of 200 nM PMA, 1 mM EDTA and 200 nM RGD peptide is shown, as indicated. The data represent means ± s.d., n = 5, ** P < 0.01.
Figure 3
Figure 3
Osteopetrosis in subjects was rescued by BMT. (a) Subject 1’s X-ray before (left) and 3 months after (right) BMT. Arrow indicates higher bone density near the growth plate. (b) Bone and cartilage formation by subject 1’s bone marrow–derived mesenchymal stem cells before and after BMT. Bone marrow samples were isolated and cultured as described in the Supplementary Methods. Cells were loaded into porous ceramic cubes coated with fibronectin and implanted into immunocompromised mice. The cubes were harvested, processed and stained with Mallory-Heidenhain at 6 weeks after implantation as described in the Supplementary Methods. Scale bar, 250 μm. (c) Ceramic cubes loaded with control cells, subject 1’s cells and subject 1’s cells after BMT were processed as in b. Bone and cartilage formation was scored as described in the Supplementary Methods. The scoring system was as follows: 1, 1–25%; 2, 26–50%; 3, 50–75% of bone and cartilage. Data are means ± s.d., n = 8, * P < 0.05. (d) Calcium accumulation by bone marrow cells from healthy controls (at least two different sources of bone marrow were used in four experiments), subject 1 and subject 1 after BMT was measured as described in the Methods; fold increase upon addition of osteogenic supplement is shown. The data represent means ± s.d., n = 4, ** P < 0.01).
Figure 4
Figure 4
Subjects have a point mutation in KINDLIN3. (a) Western blot for KINDLIN-3 in subjects’ and control lymphocytes. The positions of full-length KINDLIN-3 and its short form are indicated with arrows. Lanes 1 and 2 show samples of immortalized cell lines from different healthy individuals; lanes 3 and 4 show subjects 1 and 2, respectively. (b) Chromatograms of genomic PCR sequence. Color-coded nucleotide sequence is shown at the bottom. Analyses of subjects 1 and 2 as well as their parents (M and F) are shown. Arrow indicates the point mutation. (c) KINDLIN3 expression rescues adhesion and spreading defects in subject 1’s cells. Cells from subject 1, a healthy control and the K562 cell line were transfected with KINDLIN3-EGFP or EGFP vector control as indicated, and equal amounts of cells were plated on a fibrinogen-coated plate as described in the Supplementary Methods. Adherent cells were counted in six random fields. The data represent means ± s.d., n = 3, ** P < 0.01. (d) Expression of KINDLIN3 rescues the defect in spreading on fibronectin in subject 1’s cells. Microphotographs of EGFP- or KINDLIN3-EGFP–transfected subject 1’s cells are shown. Left, Nomarski microscopy (DIC, differential interference contrast); right, fluorescence microscopy (FL). Scale bar, 10 μm. (e) TIRF analysis of KINDLIN3-EGFP–expressing subject 1’s cells adhered to fibrinogen-coated plates. Cells were transfected with EGFP or KINDLIN3-EGFP as indicated. Cells were visualized using TIRF (left), Nomarski (center) or fluorescence (right) microscopy. Scale bar, 10 μm. (f) Knockdown of KINDLIN3 in control cells recapitulates the subjects’ cells’ adhesion and spreading defects. K562 lymphocytes or control cell lines were transfected with KINDLIN3–specific siRNA, control siRNA or remained untransfected as indicated. Adhesion assays were performed as in d. The data represent means ± s.d., n = 3, ** P < 0.01.

Comment in

  • When integrins fail to integrate.
    Hidalgo A, Frenette PS. Hidalgo A, et al. Nat Med. 2009 Mar;15(3):249-50. doi: 10.1038/nm0309-249. Nat Med. 2009. PMID: 19265824 Free PMC article. No abstract available.

References

    1. Hattori M, Minato N. Rap1 GTPase: functions, regulation, and malignancy. J Biochem. 2003;134:479–484. - PubMed
    1. Crittenden JR, et al. CalDAG-GEFI integrates signaling for platelet aggregation and thrombus formation. Nat Med. 2004;10:982–986. - PubMed
    1. Ussar S, Wang HV, Linder S, Fassler R, Moser M. The Kindlins: subcellular localization and expression during murine development. Exp Cell Res. 2006;312:3142–3151. - PubMed
    1. Rogalski TM, Mullen GP, Gilbert MM, Williams BD, Moerman DG. The UNC-112 gene in Caenorhabditis elegans encodes a novel component of cell-matrix adhesion structures required for integrin localization in the muscle cell membrane. J Cell Biol. 2000;150:253–264. - PMC - PubMed
    1. Shi X, et al. The MIG-2/integrin interaction strengthens cell-matrix adhesion and modulates cell motility. J Biol Chem. 2007;282:20455–20466. - PubMed

Publication types

MeSH terms