. 2009 Mar;41(3):299-307.
doi: 10.1038/ng.332. Epub 2009 Feb 22.

Systems genetics of complex traits in Drosophila melanogaster

Affiliations

Systems genetics of complex traits in Drosophila melanogaster

Julien F Ayroles et al. Nat Genet. 2009 Mar.

Abstract

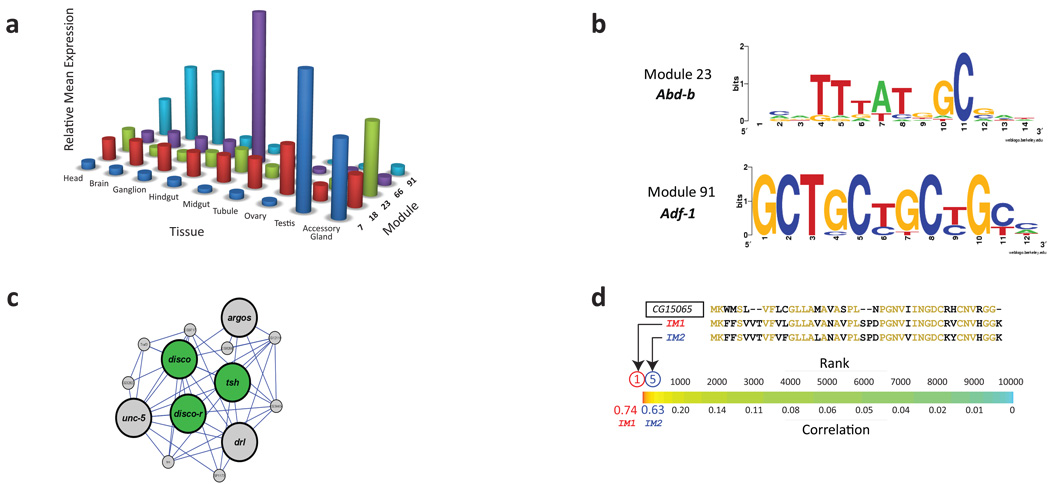
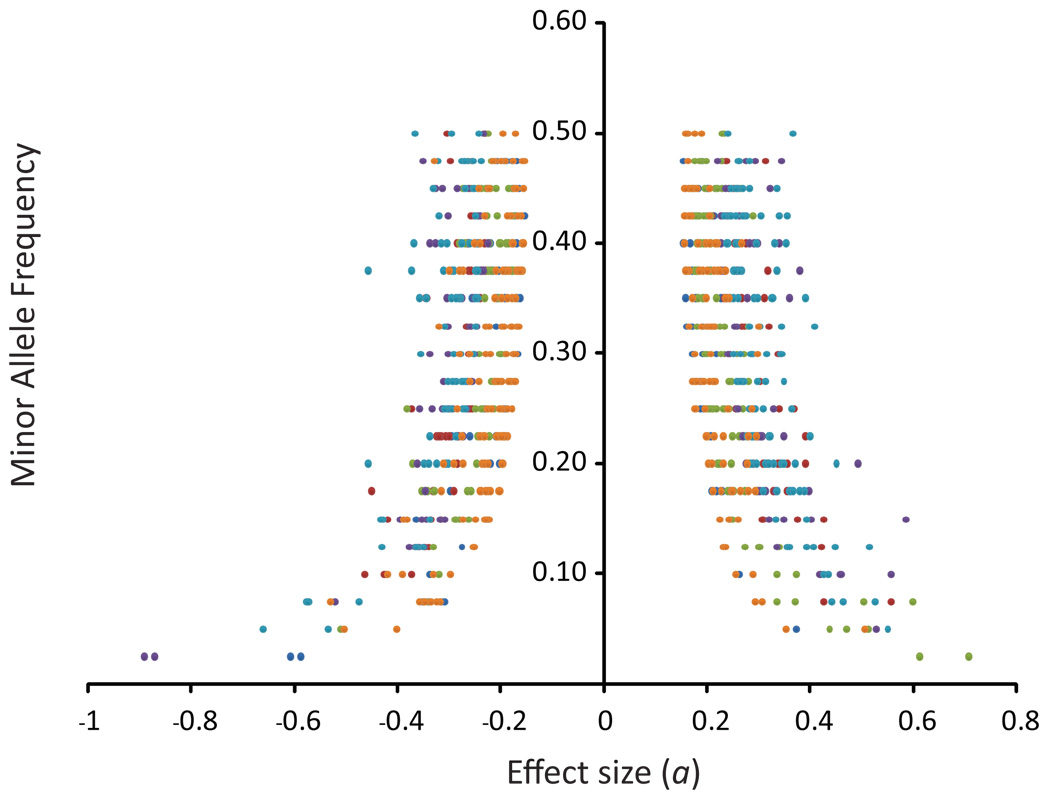
Determining the genetic architecture of complex traits is challenging because phenotypic variation arises from interactions between multiple, environmentally sensitive alleles. We quantified genome-wide transcript abundance and phenotypes for six ecologically relevant traits in D. melanogaster wild-derived inbred lines. We observed 10,096 genetically variable transcripts and high heritabilities for all organismal phenotypes. The transcriptome is highly genetically intercorrelated, forming 241 transcriptional modules. Modules are enriched for transcripts in common pathways, gene ontology categories, tissue-specific expression and transcription factor binding sites. The high degree of transcriptional connectivity allows us to infer genetic networks and the function of predicted genes from annotations of other genes in the network. Regressions of organismal phenotypes on transcript abundance implicate several hundred candidate genes that form modules of biologically meaningful correlated transcripts affecting each phenotype. Overlapping transcripts in modules associated with different traits provide insight into the molecular basis of pleiotropy between complex traits.


Figures

Figure 1
Figure 1. Variation in transcript abundance among 40 wild-derived inbred lines
(a) Sex bias for gene expression. Blue and red dots represent genes showing a 2-fold difference in gene expression between males and females, respectively. (b) Distribution of broad-sense heritabilities (H2). Dark green denotes significant H2 estimates (line FDR < 0.001) and grey indicates non-significant H2 estimates. (c) Distribution of cross-sex genetic correlations for transcripts exhibiting significant variation in sexual dimorphism (significant sex × line interaction variance at FDR < 0.001). (d) Bivariate plot of H2 estimates in males and females. Orange dots indicate significant line by sex interaction variance. (e) Chromosomal distribution of sex-biased gene expression. The dark blue and red bars are observed male and female counts, respectively, while the light blue and red bars are the expected numbers of male and female transcripts, respectively.
Figure 2
Figure 2. Correlated transcriptional modules
(a) Distribution of connectivity (average |r|) for the 10,096 genetically variable transcripts (line FDR < 0.001). (b) Relationship between transcript H2 and average connectivity. (c) Clustering of the genetically variable transcripts into 241 modules. (d) Correlated transcriptional modules for genes in the amino sugars metabolism and Notch pathway KEGG ontologies. The colors on the off-diagonal represent the average cross-module correlations.
Figure 3
Figure 3. Biology of transcriptional modules
(a) Distribution of tissue specific expression in Modules 7, 18, 23, 66, 91. Module 7 is enriched for male-biased transcripts and expression in the testes and accessory glands. Module 18 is enriched for female-biased transcripts and expression in ovaries. Module 23 is enriched for transcripts affecting reproduction and gametogenesis that are highly expressed in ovaries and male accessory glands. Module 66 is enriched for transcripts in the Notch signaling pathway and nervous system development expressed in the midgut. Module 91 is enriched for transcripts affecting the function of the nervous system with high expression in the brain. (b) Modules 23 and 91 are, respectively, enriched for the Abd-b (P = 0.004) and Adf-1 (P = 0.001) transcription factor binding motifs. Abd-b has been implicated in genital disc development and Adf-1 in memory and synaptogenesis, consistent with the inferred function of genes in these modules. (c) Network representation of module 164, emphasizing the genetic correlations between adult transcripts for three transcription factors that interact during embryonic and larval development. (d) Putative functional annotation of CG15065 as a gene encoding an Immune induced Molecule (IM). Ranking all genetically variable transcripts according to their correlation to CG15065 shows that IM1 is the strongest transcriptional correlate (r = 0.74) and IM2 is the fifth strongest (r = 0.63). The protein alignments of CG15065, IM1 and IM2 are highly conserved.
Figure 4
Figure 4. Variation for organismal phenotypes among 40 wild-derived inbred lines
Panels a–f give the distributions of line means among 40 wild-derived inbred lines. The red and blue bars in panels a–d depict females and males, respectively. Sexes were not measured separately in panels e–f. Error bars, s. e. (a) Starvation stress resistance (H2 = 0.56). (b) Chill coma recovery (H2 = 0.23). (c) Life span (H2 = 0.54). (d) Locomotor reactivity (H2 = 0.58). (e) Copulation latency (H2 = 0.25). (f) Competitive fitness (H2 = 0.32).
Figure 5
Figure 5. Distribution of SFP effects
The x-axis is the SFP allele effect, aG, where a is one half the difference in trait mean between the SFP alleles and σG is the genetic standard deviations of each trait. The y-axis is the minor allele frequency. The traits are color-coded: chill coma recovery (dark blue), starvation resistance (red), fitness (green), lifespan (purple), locomotor reactivity (turquoise), and copulation latency (orange).
Figure 6
Figure 6. Effects of P-element mutations in candidate genes affecting quantitative traits
Mutational effects are given as deviations from the co-isogenic control line. Red and blue bars represent males and females, respectively. Mutations in all genes shown have significant effects in one or both sexes (Supplementary Table 11). (a) Chill coma recovery time. (b) Starvation stress resistance. (c) Locomotor reactivity (data from Ref. 27).
Figure 7
Figure 7. Modules of correlated transcripts associated with organismal phenotypes
(a–e) Competitive fitness. (a) Clustering of the 414 transcripts significantly associated with variation in fitness into 20 modules. (b) Tissue-specific expression of transcripts in Modules 7 and 9 (ovaries), Module 8 (accessory glands and testes) and Module 17 (head, brain, and thoracicoabdominal ganglion). (c) Interaction network for Module 7. Each node represents a gene and each edge the correlation between a pair of genes. Module 7 is enriched for female-biased transcripts and transcripts affecting DNA replication. (d) Interaction network for Module 9. Module 9 is enriched for female-biased transcripts and transcripts affecting oogenesis and transcriptional regulation. (e) Interaction network for Module 8. Module 8 is dominated by male-biased genes, and is enriched for genes involved in male-induced post-mating behaviors, including three accessory gland proteins (Acps). (f–g) Starvation stress resistance. (f) Clustering of the 355 transcripts significantly associated with variation in starvation resistance into 11 modules. (g) Interaction network for Module 6. The black arrows indicate SFP variants in a probe set that are associated with variation in expression of the other probes in that probe set (cis-acting variants) and with variation in another transcript (trans-acting variants). The orange nodes indicate genes with a WD40 protein domain.
Figure 8
Figure 8. Pleiotropy between phenotypic modules
Grey lines connect modules with a significant overlap of greater than four genes between gene lists, as determined by Fisher Exact Tests.

References

    1. Falconer DS, Mackay TFC. Introduction to Quantitative Genetics. Addison Wesley Longman: Harlow; 1996.
    1. Lynch M, Walsh B. Genetics and Analysis of Quantitative Traits. Sunderland, Massachusetts: Sinauer Associates; 1998.
    1. Wellcome Trust Case Control Consortium. Genome-wide association study of 14,000 cases of seven common diseases and 3,000 shared controls. Nature. 2007;447:661–678. - PMC - PubMed
    1. Mackay TFC, Anholt RRH. Of flies and man: Drosophila as a model for human complex traits. Ann. Rev. Genomics Hum. Genetics. 2006;7:339–367. - PubMed
    1. Valdar W, et al. Genetic and environmental effects on complex traits in mice. Genetics. 2006;174:959–984. - PMC - PubMed

Publication types