. 2009 Mar;41(3):371-5.
doi: 10.1038/ng.330. Epub 2009 Feb 22.

Co-regulated transcriptional networks contribute to natural genetic variation in Drosophila sleep

Affiliations

Co-regulated transcriptional networks contribute to natural genetic variation in Drosophila sleep

Susan T Harbison et al. Nat Genet. 2009 Mar.

Abstract

Sleep disorders are common in humans, and sleep loss increases the risk of obesity and diabetes. Studies in Drosophila have revealed molecular pathways and neural tissues regulating sleep; however, genes that maintain genetic variation for sleep in natural populations are unknown. Here, we characterized sleep in 40 wild-derived Drosophila lines and observed abundant genetic variation in sleep architecture. We associated sleep with genome-wide variation in gene expression to identify candidate genes. We independently confirmed that molecular polymorphisms in Catsup (Catecholamines up) are associated with variation in sleep and that P-element mutations in four candidate genes affect sleep and gene expression. Transcripts associated with sleep grouped into biologically plausible genetically correlated transcriptional modules. We confirmed co-regulated gene expression using P-element mutants. Quantitative genetic analysis of natural phenotypic variation is an efficient method for revealing candidate genes and pathways.


Figures

Figure 1
Figure 1. Variation in sleep phenotypes among wild-derived inbred lines
a–e, Line means for sleep phenotypes for males (blue bars) and females (pink bars), and sexual dimorphism (female – male) in sleep phenotypes (purple bars). Error bars are ± standard error of the mean. a, Night sleep. b, Day sleep. c, Waking activity. d, Night bout number. e, Day bout number. f, Genetic correlation (rG) between night and day sleep time (P = 0.074). g, Genetic correlation between night bout number and day bout number (P = 0.962).
Figure 2
Figure 2. Association between sleep phenotypes and Catsup polymorphisms
a, P-values (log(1/P), y-axis) from association tests of Catsup polymorphisms (x-axis) and day bout number (teal), day sleep time (light purple), night bout number (blue), night sleep time (dark purple) and waking activity (gold). The black and red dotted lines depict the permutation test-derived P-value threshold (0.0412) and the Bonferroni threshold (0.0014), respectively. b, Schematic diagram of the Catsup protein showing the type and location of significant polymorphisms. Yellow indicates a non-synonymous change, green indicates a deleted region, and pink indicates a synonymous change.
Figure 3
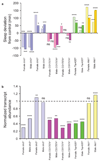
Figure 3. Validation of sleep candidate genes
Mutations in bin3, CG17574, Tsp42Ef, and Akt1 are colour-coded blue, pink, green and yellow, respectively. Specific alleles tested are bin3BG01137, bin3BG01416, CG17574BG02368, CG17574BG00992, Tsp42EfBG00864, and Akt1BG00351, and are listed in that order on the figure. a, Mean day (light shading) and night (dark shading) sleep times for males and females of P-element insertion mutations, expressed as deviations from the isogenic control line. b, Normalized transcript abundance for each P-element insertion line. The dashed line represents the isogenic control; bars indicate the transcript level relative to the isogenic control. *: 0.01 ≤ P < 0.05; **: 0.001 ≤ P < 0.01; ***: 0.0001 ≤ P < 0.001; ****: P < 0.0001; ns: P > 0.05.
Figure 4
Figure 4. Analyses of candidate genes associated with natural variation in sleep phenotypes
a, Modules of correlated transcripts associated with day sleep (20 modules), night sleep (9 modules), day bout number (3 modules), night bout number (9 modules), and waking activity (5 modules). Each point represents the correlation between two genes. The colour scale bar indicates the value of the correlation. b, Network of correlated (|r| ≥ 0.7) transcripts for night sleep Module 6. The pink circle represents bin3, yellow circles represent genes whose connectivity with bin3 was verified by RT-PCR, and orange circles represent genes for which associations with both transcripts and SFPs are signficant. The blue circle identifies a gene implicated in a previous microarray study of sleeping flies. c, Percentage of homologous genes (including orthologues and paralogues) across the 12 Drosophila species for night sleep time (dark purple), day sleep time (light purple), night bout number (blue), day bout number (teal) and waking activity (gold), compared to all D. melanogaster genes (black). Species are in order of evolutionary distance from D. melanogaster. d, Frequency distribution of ω for each sleep phenotype. Colours are the same as in (d). Night sleep (χ2 = 21.9, P = 0.005), day sleep (χ2 = 74.7, P <0.0001) and day bout number (χ2 = 15.7, P = 0.047) had significantly different distributions from that of all genes.

References

    1. Knutson KL, Van Cauter E. Associations between sleep loss and increased risk of obesity and diabetes. Ann. N. Y. Acad. Sci. 2008;1129:287–304. - PMC - PubMed
    1. Hendricks JC et al. Rest in Drosophila is a sleep-like state. Neuron. 2000;25:129–138. - PubMed
    1. Shaw PJ, Cirelli C, Greenspan RJ, Tononi G. Correlates of sleep and waking in Drosophila melanogaster . Science. 2000;287:1834–1837. - PubMed
    1. Cirelli C et al. Reduced sleep in Drosophila Shaker mutants. Nature. 2005;434:1087–1092. - PubMed
    1. Kume K, Kume S, Park SK, Hirsh J, Jackson FR. Dopamine is a regulator of arousal in the fruit fly. J. Neurosci. 2005;25:7377–7384. - PMC - PubMed

Publication types

Substances

Associated data

LinkOut - more resources