. 2009;4(2):e4567.
doi: 10.1371/journal.pone.0004567. Epub 2009 Feb 23.

Disruption of growth hormone receptor prevents calorie restriction from improving insulin action and longevity

Affiliations

Disruption of growth hormone receptor prevents calorie restriction from improving insulin action and longevity

Michael S Bonkowski et al. PLoS One. 2009.

Retraction in

Abstract

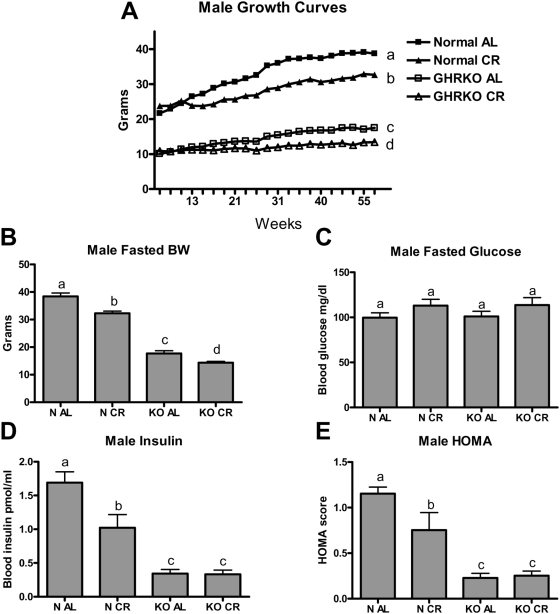
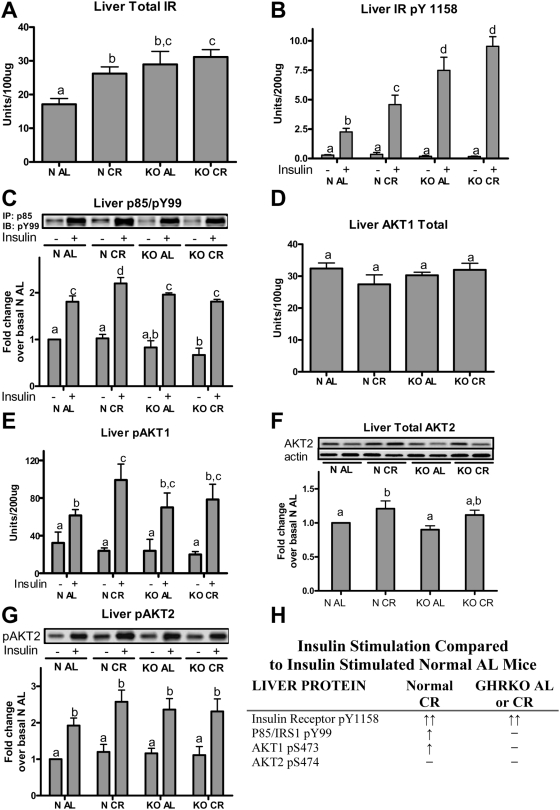
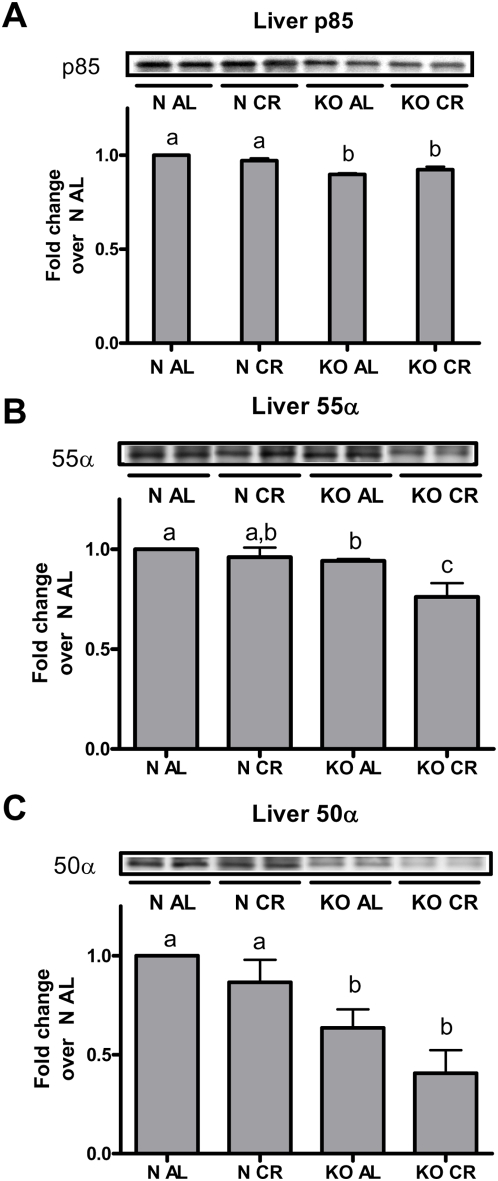
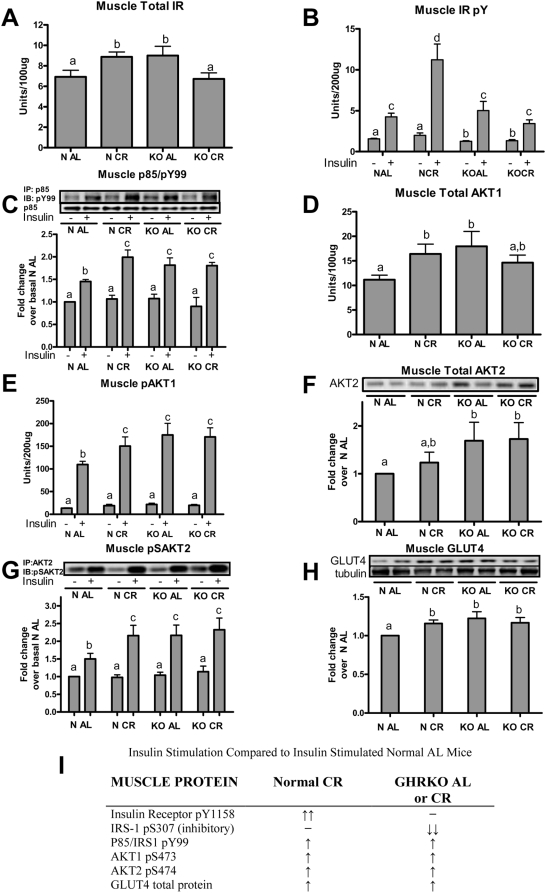
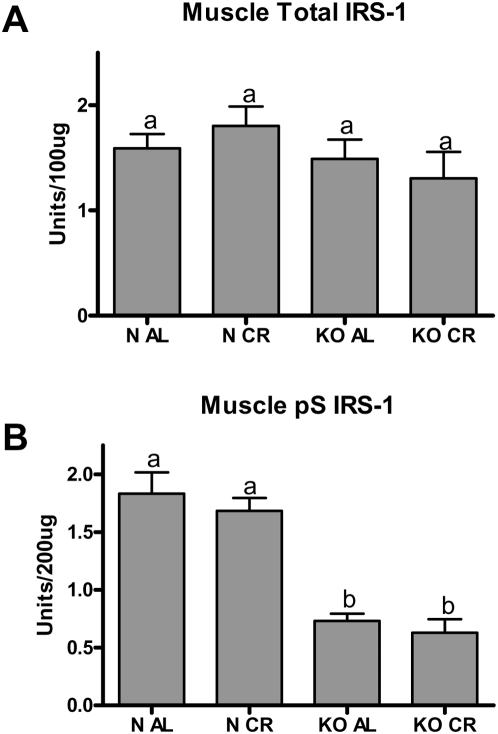
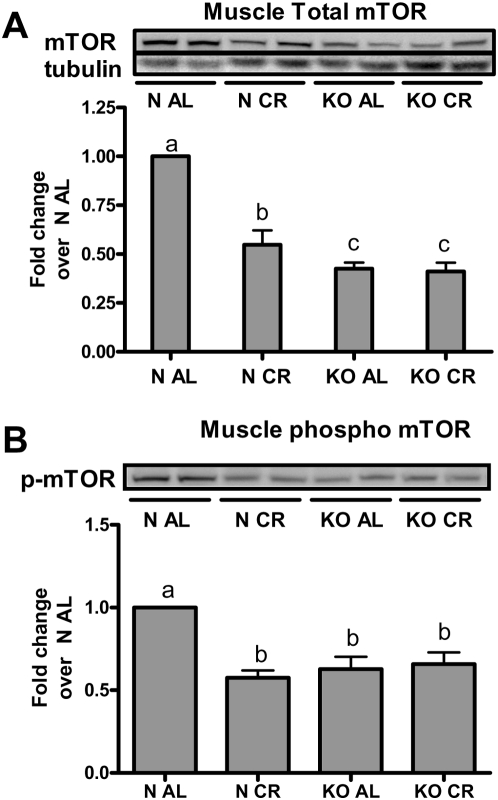
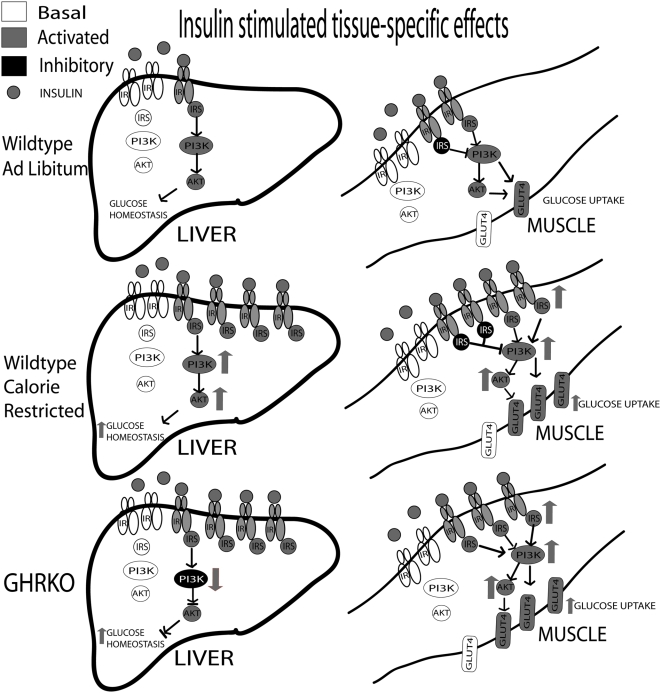
Most mutations that delay aging and prolong lifespan in the mouse are related to somatotropic and/or insulin signaling. Calorie restriction (CR) is the only intervention that reliably increases mouse longevity. There is considerable phenotypic overlap between long-lived mutant mice and normal mice on chronic CR. Therefore, we investigated the interactive effects of CR and targeted disruption or knock out of the growth hormone receptor (GHRKO) in mice on longevity and the insulin signaling cascade. Every other day feeding corresponds to a mild (i.e. 15%) CR which increased median lifespan in normal mice but not in GHRKO mice corroborating our previous findings on the effects of moderate (30%) CR on the longevity of these animals. To determine why insulin sensitivity improves in normal but not GHRKO mice in response to 30% CR, we conducted insulin stimulation experiments after one year of CR. In normal mice, CR increased the insulin stimulated activation of the insulin signaling cascade (IR/IRS/PI3K/AKT) in liver and muscle. Livers of GHRKO mice responded to insulin by increased activation of the early steps of insulin signaling, which was dissipated by altered PI3K subunit abundance which putatively inhibited AKT activation. In the muscle of GHRKO mice, there was elevated downstream activation of the insulin signaling cascade (IRS/PI3K/AKT) in the absence of elevated IR activation. Further, we found a major reduction of inhibitory Ser phosphorylation of IRS-1 seen exclusively in GHRKO muscle which may underpin their elevated insulin sensitivity. Chronic CR failed to further modify the alterations in insulin signaling in GHRKO mice as compared to normal mice, likely explaining or contributing to the absence of CR effects on insulin sensitivity and longevity in these long-lived mice.


Conflict of interest statement

Competing Interests: The authors have declared that no competing interests exist.

Figures

Figure 1
Figure 1. Metabolic parameters of male GHRKO (KO) and normal (N) mice fed ad libitum (AL) or subjected to 30% calorie restriction (CR) for one year.
Panel (A) shows time-course changes in body weight over a one year period. After one year of CR, all groups were fasted overnight and bodyweight (B), peripheral glucose (C), insulin (D), and calculated homeostatic model of assessment (HOMA, E) were determined. Values with unlike superscripts/letters are significantly different (P<0.05).
Figure 2
Figure 2. Liver insulin signaling cascade total proteins and phospho-proteins in response to insulin stimulation (10 IU/kg) versus saline treated controls in GHRKO (KO) and normal (N) mice fed ad libitum (AL) or 30% calorie restricted (CR) for one year.
ELISA with antibodies directed towards total insulin receptor (IR; A), IR pY1158 (B), AKT1 (D), and AKT1 pS473 (E) were performed. Liver homogenates were immunoprecipitated (IP) with anti-p85, separated using SDS-PAGE and the level of non-specific Tyr phosphorylation was determined at approximately 180 kDa using anti-pY99 (C). Total AKT2 protein (F) and AKT2 pS473/474 (G) was determined from liver protein homogenates first subjected to IP using anti-AKT2. Panel (H) summarizes key insulin-stimulated phospho-proteins compared to insulin-stimulated N AL mice. Bands are representative blots from 4–6 male mice per phenotype/diet/treatment group. Values with unlike superscripts/letters are significantly different (P<0.05).
Figure 3
Figure 3. Liver PI3K subunit abundance in GHRKO (KO) and normal (N) mice fed ad libitum (AL) or 30% calorie restriction (CR) for one year.
Liver protein isolates were immunoprecipitated (IP) with anti-pan-p85. Total p85α (A), 55α (B) and 50α (C) subunits were separated using SDS-PAGE, transferred to nitrocellulose membranes and blotted with anti-pan-p85. Bands are representative blots from 4–6 male mice per phenotype/diet/treatment group. Values with unlike superscripts/letters are significantly different (P<0.05).
Figure 4
Figure 4. Muscle insulin signaling cascade total proteins and phospho-proteins in response to insulin stimulation (10 IU/kg) versus saline treated controls in GHRKO (KO) and normal (N) mice fed ad libitum (AL) or 30% calorie restriction (CR) for one year.
Levels of total insulin receptor (IR; A), IR pY1158 (B), AKT1 (D), and AKT1 pS473 (E) were determined using ELISA. Liver homogenates were immunoprecipitated (IP) with anti-p85, separated using SDS-PAGE and the level of non-specific Tyr phosphorylation was determined at approximately 180 kDa (corresponding to IRS proteins) using anti-pY99 (C). Total AKT2 protein (F) and AKT2 pS473/474 (G) was determined from liver protein homogenates first subjected to IP using anti-AKT2. Total GLUT4 protein (H) was determined in muscle homogenates using anti-GLUT4. Panel (I) summarizes key insulin-stimulated phospho-proteins compared to insulin-stimulated N AL mice. Bands are representative blots from 4–6 male mice per phenotype/diet/treatment group. Values with unlike superscripts/letters are significantly different (P<0.05).
Figure 5
Figure 5. Muscle total IRS-1 protein (A) and IRS-1 pS307 inhibitory phosphorylation (B) in GHRKO (KO) and normal (N) mice fed ad libitum (AL) or 30% calorie restriction (CR) for one year was determined using ELISA.
Bars represent 6–8 animals per phenotype/diet group. Values with unlike superscripts/letters are significantly different (P<0.05).
Figure 6
Figure 6. Muscle total mTOR protein (A) and mTOR pS2448 (B) in GHRKO (KO) and normal (N) mice fed ad libitum (AL) or 30% calorie restriction (CR) for one year were determined using western blotting.
Bars represent 6–8 animals per phenotype/diet group.
Figure 7
Figure 7. Summarizes the effects of CR, or lack thereof, in wildtype and GHRKO mice under insulin-stimulated conditions.
Solid grey proteins represent stimulatory activation, while solid black proteins are inhibitory.

References

    1. Tatar M, Bartke A, Antebi A. The endocrine regulation of aging by insulin-like signals. Science. 2003;299:1346–1351. - PubMed
    1. Kenyon C. The plasticity of aging: insights from long-lived mutants. Cell. 2005;120:449–460. - PubMed
    1. Dominici FP, Argentino DP, Munoz MC, Miquet JG, Sotelo AI, Turyn D. Influence of the crosstalk between growth hormone and insulin signalling on the modulation of insulin sensitivity. Growth Horm IGF Res. 2005;15:324–336. - PubMed
    1. Heilbronn LK, Ravussin E. Calorie restriction and aging: review of the literature and implications for studies in humans. Am J Clin Nutr. 2003;78:361–369. - PubMed
    1. Koubova J, Guarente L. How does calorie restriction work? Genes Dev. 2003;17:313–321. - PubMed

Publication types