. 2009 Jul;71(5):1189-227.
doi: 10.1007/s11538-009-9399-5. Epub 2009 Feb 21.

Front instabilities and invasiveness of simulated avascular tumors

Affiliations

Front instabilities and invasiveness of simulated avascular tumors

Nikodem J Popławski et al. Bull Math Biol. 2009 Jul.

Abstract

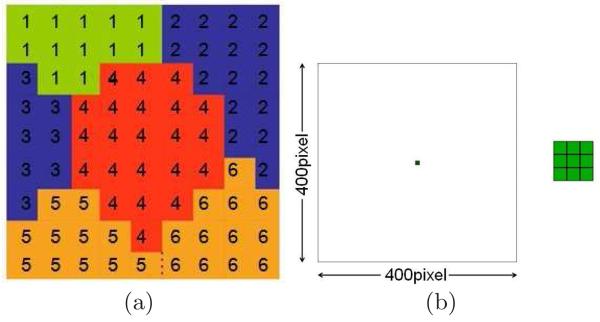
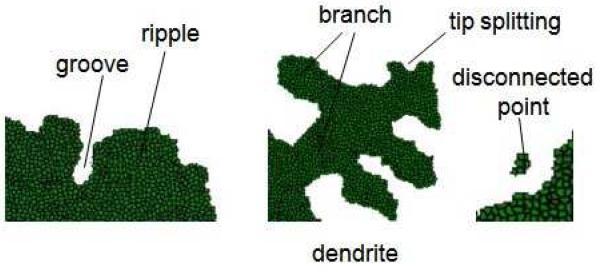
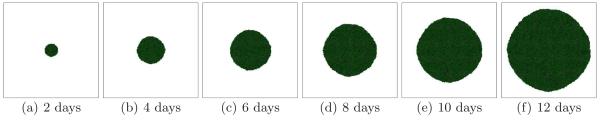
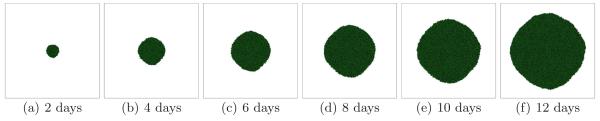
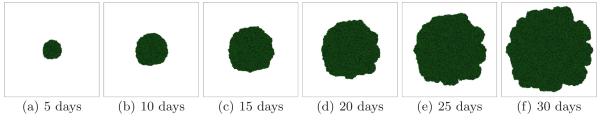
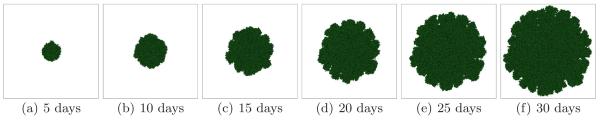
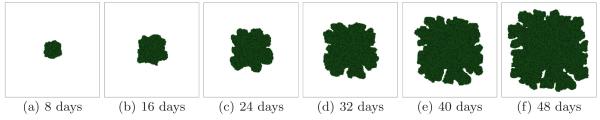
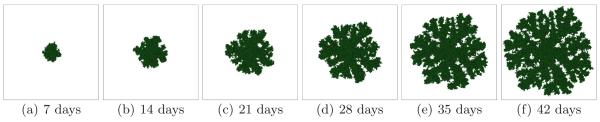
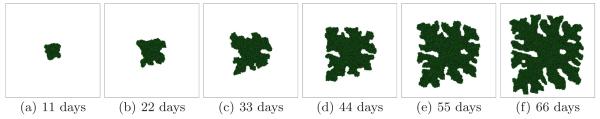
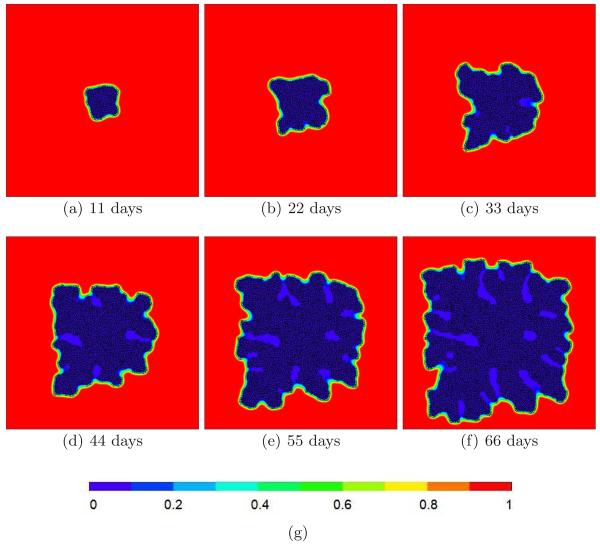
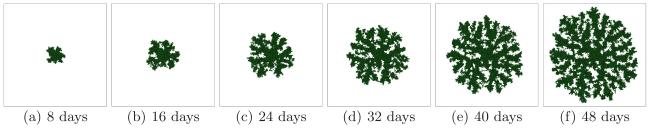
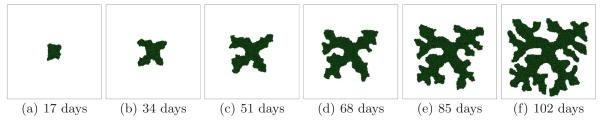
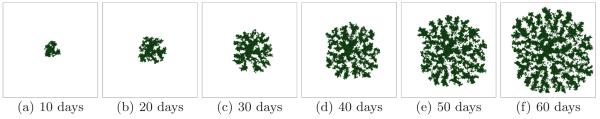
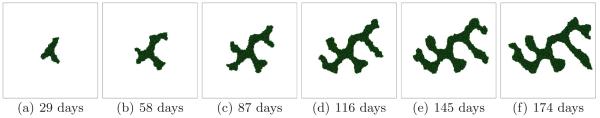
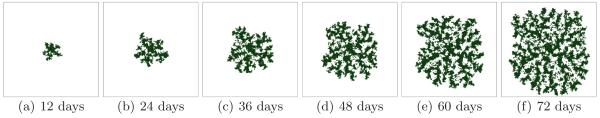
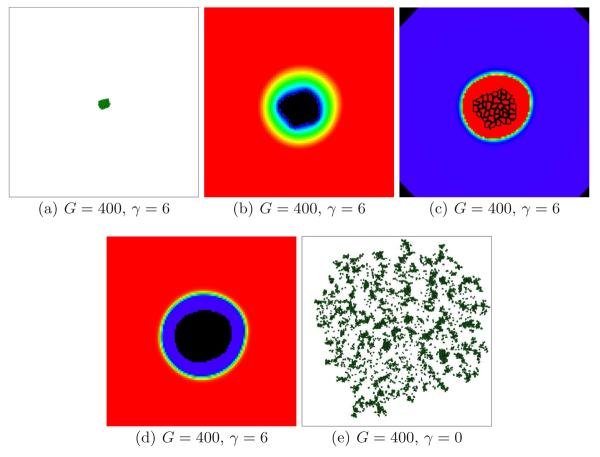
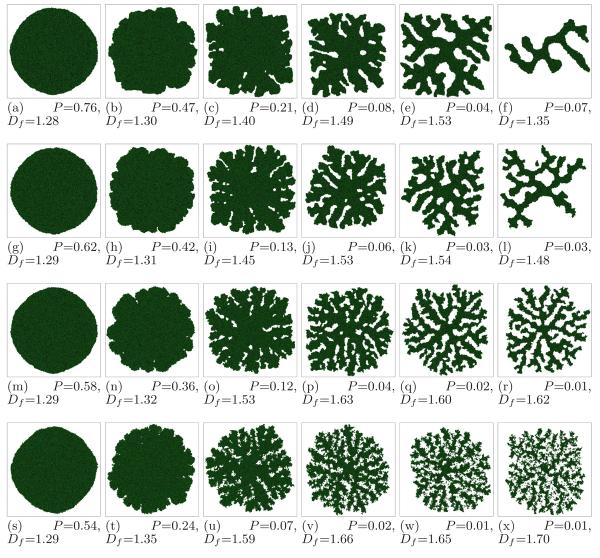
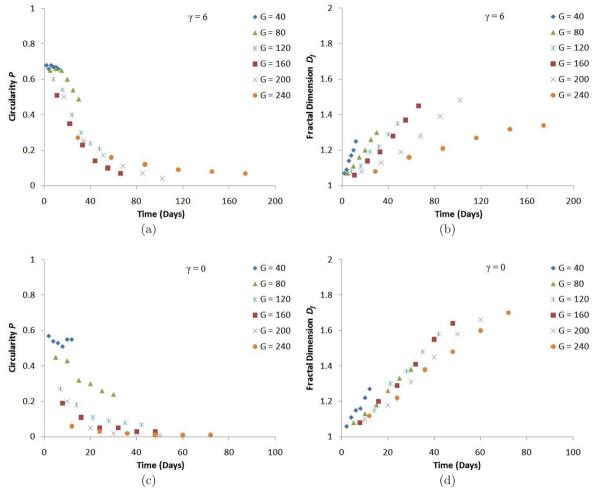
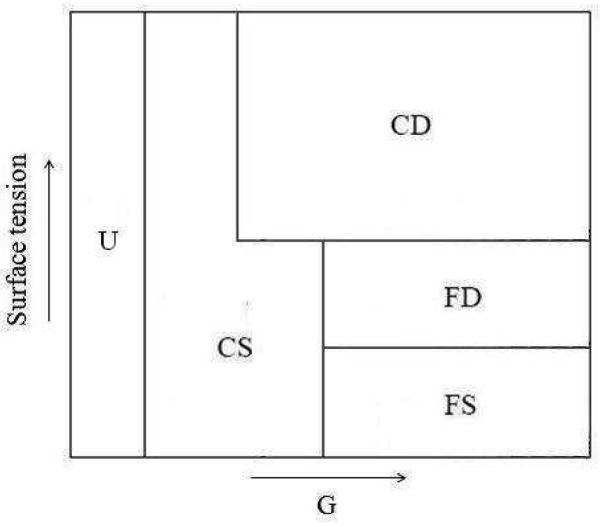
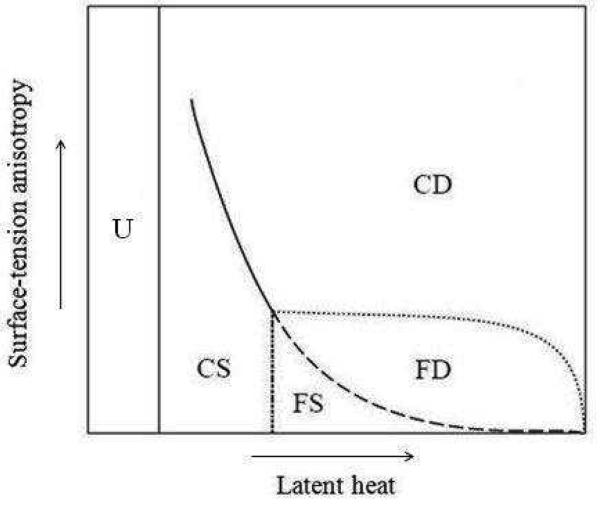
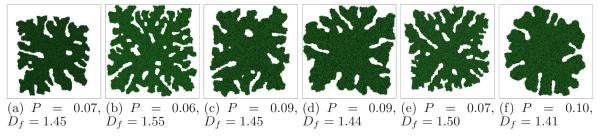
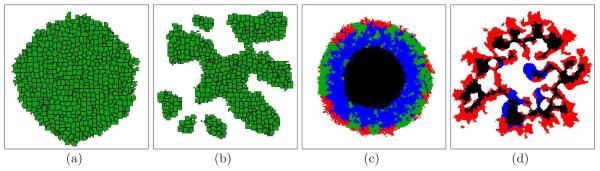
We study the interface morphology of a 2D simulation of an avascular tumor composed of identical cells growing in an homogeneous healthy tissue matrix (TM), in order to understand the origin of the morphological changes often observed during real tumor growth. We use the Glazier-Graner-Hogeweg model, which treats tumor cells as extended, deformable objects, to study the effects of two parameters: a dimensionless diffusion-limitation parameter defined as the ratio of the tumor consumption rate to the substrate transport rate, and the tumor-TM surface tension. We model TM as a nondiffusing field, neglecting the TM pressure and haptotactic repulsion acting on a real growing tumor; thus, our model is appropriate for studying tumors with highly motile cells, e.g., gliomas. We show that the diffusion-limitation parameter determines whether the growing tumor develops a smooth (noninvasive) or fingered (invasive) interface, and that the sensitivity of tumor morphology to tumor-TM surface tension increases with the size of the dimensionless diffusion-limitation parameter. For large diffusion-limitation parameters, we find a transition (missed in previous work) between dendritic structures, produced when tumor-TM surface tension is high, and seaweed-like structures, produced when tumor-TM surface tension is low. This observation leads to a direct analogy between the mathematics and dynamics of tumors and those observed in nonbiological directional solidification. Our results are also consistent with the biological observation that hypoxia promotes invasive growth of tumor cells by inducing higher levels of receptors for scatter factors that weaken cell-cell adhesion and increase cell motility. These findings suggest that tumor morphology may have value in predicting the efficiency of antiangiogenic therapy in individual patients.


Figures

Fig. 1
Fig. 1
(a) Detail of a typical GGH Cell-Lattice configuration in 2D showing portions of six Generalized Cells. Each Generalized Cell is a collection of Cell-Lattice sites (squares) with the same index value. The colors indicate Generalized-Cell types. The number of Cell-Lattice sites in a Generalized Cell is its volume and the number of links along its boundary (interfaces with sites containing other indices) is its surface area. (b) The initial 2D configuration for all our simulations: nine tumor cells situated at the center of the simulation domain. The space outside the cells represents normal tissue with an initially homogeneous density and concentration of substrate (see subsection 3.4). The size of the Cell Lattice corresponds to 16 mm. The inset shows an enlargement of the tumor cells.
Fig. 2
Fig. 2
Terminology describing the morphology of simulated tumors.
Fig. 3
Fig. 3
Tumor growth in a 2D simulation with G = 40 and γ = 6. See text for other parameter values. The surface of the developing spherical tumor is smooth - U.
Fig. 4
Fig. 4
Tumor growth in a 2D simulation with G = 40 and γ = 0. See text for other parameter values. The surface of the developing spherical tumor is smooth, as in Figure 3 - U.
Fig. 5
Fig. 5
Tumor growth in a 2D simulation with G = 80 and γ = 6. See text for other parameter values. The surface of the developing compact tumor is grooved - CS.
Fig. 6
Fig. 6
Tumor growth in a 2D simulation with G = 80 and γ = 0. See text for other parameter values. The surface of the developing tumor is grooved and slightly more irregular than that in Figure 5 - CS.
Fig. 7
Fig. 7
Tumor growth in a 2D simulation with G = 120 and γ = 6. See text for other parameter values. The surface of the developing tumor produces thick fingers with narrow valleys - CD.
Fig. 8
Fig. 8
Tumor growth in a 2D simulation with G = 120 and γ = 0. See text for other parameter values. The surface of the developing tumor is much more branched than that in Figure 7 - CS.
Fig. 9
Fig. 9
Tumor growth in a 2D simulation with G = 160 and γ = 6. See text for other parameter values. The developing tumor produces thinner fingers with deep valleys, approaching a dendritic morphology - CD.
Fig. 10
Fig. 10
(a)–(f) Substrate concentrations in a 2D simulation with G = 160 and γ = 6. See text for other parameter values. The substrate only penetrates a thin layer of the tumor, producing a fingering instability. (g) Color code for substrate concentration.
Fig. 11
Fig. 11
Tumor growth in a 2D simulation with G = 160 and γ = 0. See text for other parameter values. The developing seaweed-like or DLA-like tumor produces numerous thin branches - FS.
Fig. 12
Fig. 12
Tumor growth in a 2D simulation with G = 200 and γ = 6. See text for other parameter values. The developing tumor has a square dendritic structure - CD.
Fig. 13
Fig. 13
Tumor growth in a 2D simulation with G = 200 and γ = 0. See text for other parameter values. The developing seaweed-like or DLA-like tumor produces thin branches that detach from the backbone of the tumor - FS.
Fig. 14
Fig. 14
Tumor growth in a 2D simulation with G = 240 and γ = 6. See text for other parameter values. The developing tumor has a truncated square dendritic structure - CD.
Fig. 15
Fig. 15
Tumor growth in a 2D simulation with G = 240 and γ = 0. See text for other parameter values. The developing seaweed-like or DLA-like tumor produces thin branches that detach from the backbone of the tumor - FS.
Fig. 16
Fig. 16
(a) Under-developed tumor in a 2D simulation with G = 400 and γ = 6 after 150 days. See text for other parameter values. (b) The enlarged tumor from subfigure (a) and the substrate concentration c near the tumor-TM interface. Black - c = 0, red - c = 1. (c) The MDE concentration m. (d) The TM concentration f. (e) Dispersing tumor in a 2D simulation with G = 400 and γ = 0 after 120 days. See text for other parameter values.
Fig. 17
Fig. 17
Tumor morphologies as a function of γ and G (see text for other parameter values), observed when the simulated tumor reaches the size of the simulation domain (∼16 mm). First row - γ = 6, second - γ = 4, third - γ = 2, fourth - γ = 0. First column - G = 40, second - G = 80, third - G = 120, fourth - G = 160, fifth - G = 200, sixth - G = 240.
Fig. 18
Fig. 18
(a) Circularity P as a function of time for 2D simulations of tumor growth with γ = 6. (b) Fractal dimension Df as a function of time for 2D simulations of tumor growth with γ = 6. (c) Circularity P as a function of time for 2D simulations of tumor growth with γ = 0. (d) Fractal dimension Df as a function of time for 2D simulations of tumor growth with γ = 0.
Fig. 19
Fig. 19
Schematic phase diagram for GGH simulations of tumor growth showing five regions: unbranched structures (U), compact seaweeds (CS), compact dendrites (CD), fractal dendrites (FD), and fractal seaweeds (FS), as a function of G and γ.
Fig. 20
Fig. 20
Schematic phase diagram for directional solidification showing five regions: unbranched structures (U), compact seaweeds (CS), compact dendrites (CD), fractal dendrites (FD), and fractal seaweeds (FS), as a function of latent heat and surface-tension anisotropy. Adapted from (Brener et al., 1992; Stalder and Bilgram, 2001).
Fig. 21
Fig. 21
Tumor morphologies with G = 160 and γ = 6 for different constraints, contact energies, and interaction ranges. (a) Figure 9(f). (b) λV = 40. (c) λV = 10. (d) λS = 1. (e) J(m, t) = J(t, t) = 12. (f) Eighth-neighbor interaction range. All other parameters as in Figure 9. The standard deviation for Df is ∼ 0.01, and for P is less than 0.01.
Fig. 22
Fig. 22
(a) 2D cross section of a 3D tumor with G = 40 and γ = 6. (b) 2D cross section of a 3D tumor with G = 120 and γ = 6. (c) Preliminary simulation of an unbranched avascular multi-cell-type tumor with G = 40 and γ = 2. Green - normal tumor cells, blue - quiescent tumor cells, black - necrotic tumor cells, red - mutated (less adhesive and more invasive) tumor cells. (d) Preliminary simulation of a branched multi-cell-type tumor with G = 160 and γ = 2. Blue - normal and quiescent tumor cells, black - necrotic tumor cells, red - mutated tumor cells.

References

    1. Anderson ARA. A hybrid mathematical model of solid tumour invasion: the importance of cell adhesion. Math. Med. Biol. 2005;22:163. - PubMed
    1. Anderson ARA, Chaplain MAJ. Continuous and discrete mathematical models of tumourinduced angiogenesis angiogenesis. Bull. Math. Biol. 1998;60:857. - PubMed
    1. Anderson ARA, Chaplain MAJ, Newman EL, Steele RJC, Thompson AM. Mathematical modelling of tumour invasion and metastasis. J. Theor. Med. 2000;2:129.
    1. Anderson ARA, Weaver AM, Cummings PT, Quaranta V. Tumor morphology and phenotypic evolution driven by selective pressure from the microenvironment. Cell. 2006;127:905. - PubMed
    1. Anderson ARA, Rejniak KA, Gerlee P, Quaranta V. Microenvironment driven invasion: a multiscale multimodel investigation. J. Math. Biol. 2007 in review. - PMC - PubMed

Publication types

LinkOut - more resources