. 2009 Jan;36(1):174-89.
doi: 10.1118/1.3031114.

Validation of CT dose-reduction simulation

Affiliations

Validation of CT dose-reduction simulation

Parinaz Massoumzadeh et al. Med Phys. 2009 Jan.

Abstract

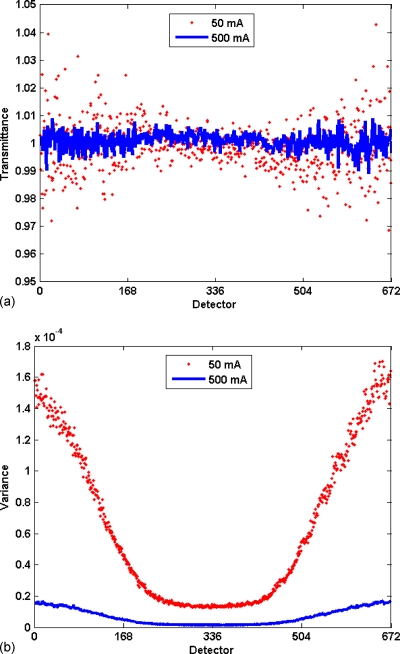
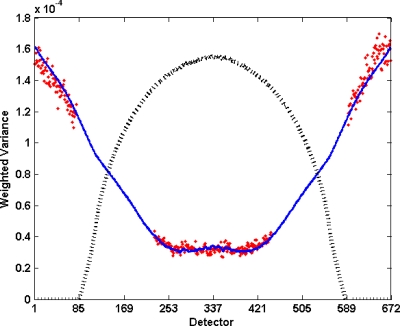
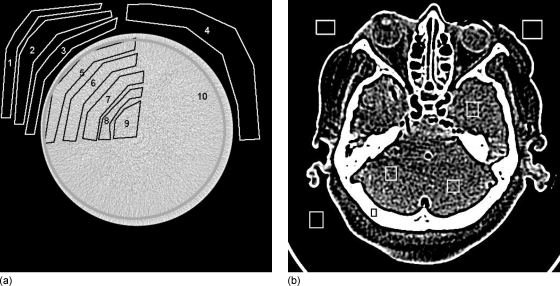
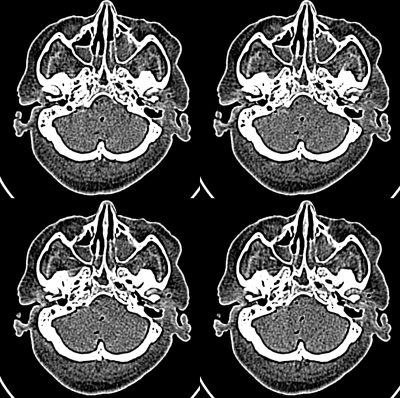
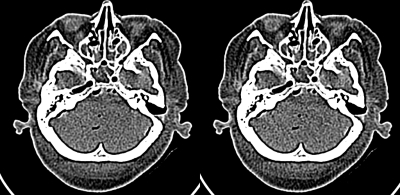
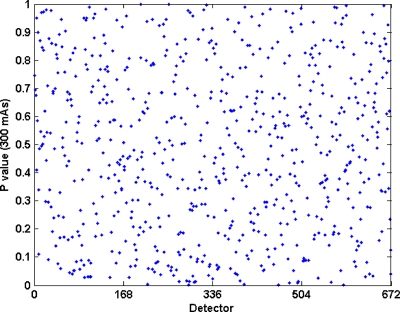
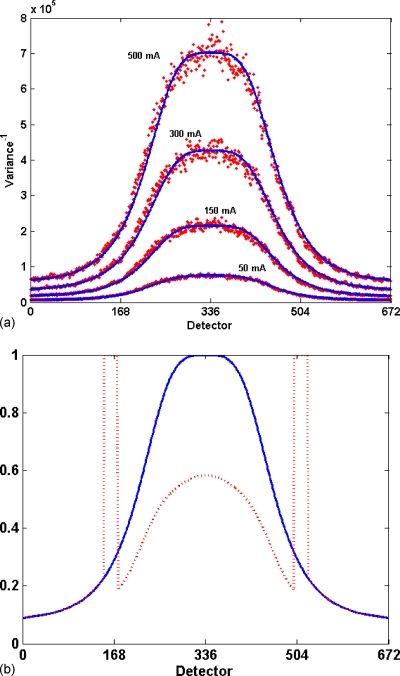
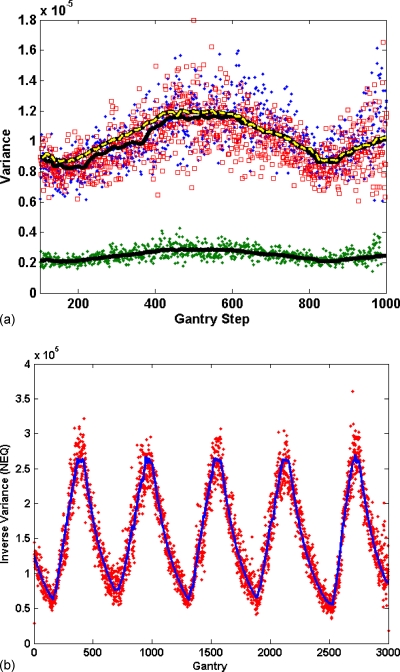
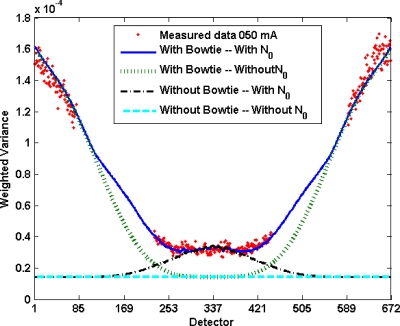
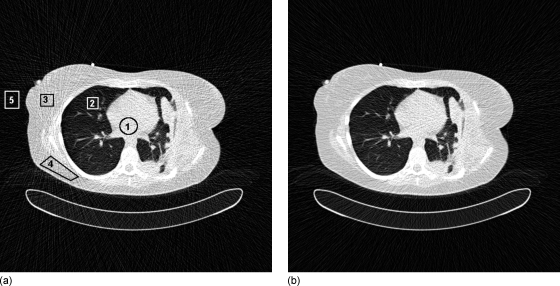
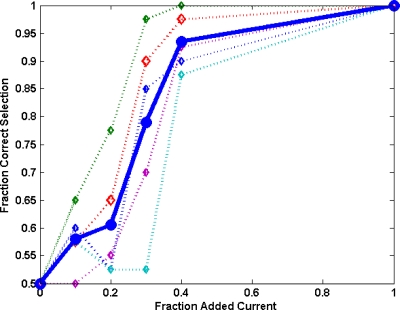
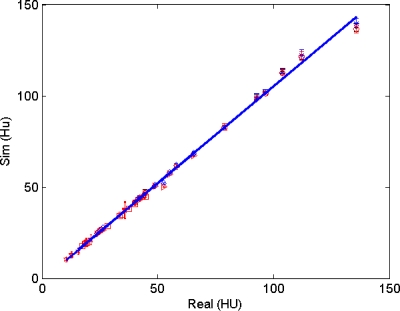
The objective of this research was to develop and validate a custom computed tomography dose-reduction simulation technique for producing images that have an appearance consistent with the same scan performed at a lower mAs (with fixed kVp, rotation time, and collimation). Synthetic noise is added to projection (sinogram) data, incorporating a stochastic noise model that includes energy-integrating detectors, tube-current modulation, bowtie beam filtering, and electronic system noise. Experimental methods were developed to determine the parameters required for each component of the noise model. As a validation, the outputs of the simulations were compared to measurements with cadavers in the image domain and with phantoms in both the sinogram and image domain, using an unbiased root-mean-square relative error metric to quantify agreement in noise processes. Four-alternative forced-choice (4AFC) observer studies were conducted to confirm the realistic appearance of simulated noise, and the effects of various system model components on visual noise were studied. The "just noticeable difference (JND)" in noise levels was analyzed to determine the sensitivity of observers to changes in noise level. Individual detector measurements were shown to be normally distributed (p > 0.54), justifying the use of a Gaussian random noise generator for simulations. Phantom tests showed the ability to match original and simulated noise variance in the sinogram domain to within 5.6% +/- 1.6% (standard deviation), which was then propagated into the image domain with errors less than 4.1% +/- 1.6%. Cadaver measurements indicated that image noise was matched to within 2.6% +/- 2.0%. More importantly, the 4AFC observer studies indicated that the simulated images were realistic, i.e., no detectable difference between simulated and original images (p = 0.86) was observed. JND studies indicated that observers' sensitivity to change in noise levels corresponded to a 25% difference in dose, which is far larger than the noise accuracy achieved by simulation. In summary, the dose-reduction simulation tool demonstrated excellent accuracy in providing realistic images. The methodology promises to be a useful tool for researchers and radiologists to explore dose reduction protocols in an effort to produce diagnostic images with radiation dose "as low as reasonably achievable".


Figures

Figure 1
Figure 1
The effect of bowtie filter on signal statistics. (a) Plot of mean transmittance signal as a function of detector position for air scans at 50 (points) and 500 mA s (line) in a 16-row scanner, with mean transmittance of Td(50mA)¯=1.0002±0.0019 and Td(500mA)¯=1.0001±0.0009 over 2000 gantry steps. (b) Plot of the variance of transmission signal for the same two scans. While the means are similar and relatively constant, the variance is non-uniform, being greatest in the low-flux periphery areas, and its magnitude is inversely proportional to the current.
Figure 2
Figure 2
Plot of transmittance variance divided by mean transmittance as a function of detector position for scan of a 35.4 cm cylinder for 50 mA s. For uniform flux (no bowtie) with no additive system noise, this would be expected to be a constant, but the bowtie filter and system noise cause excess variance. Points represent the measurement and the solid line represents the noise model of Eqs. 1, 2, with parameters (K=3242 and N0=38) selected to minimize the square of the relative error. The dotted line corresponds to cylinder profile (not to scale) as a function of detector position.
Figure 3
Figure 3
Images of cylinder and cadaver head, showing selected ROI. Statistics for each ROI were collected and analyzed. Plot of image-domain noise shown in Fig. 12 to determine accuracy of simulations.
Figure 4
Figure 4
Image of four-up cadaver head used in 4AFC study. Upper left simulated 150–50 mAs ; upper right original 50 mAs , lower left simulated 300–50 mAs , and lower right simulated 500–50 mAs .
Figure 5
Figure 5
Presentation image for two cadaver head slices used in JND study (simulated images were prepared from a 500-mAs cadaver head scan). Image on the right is simulated at 50 mAs current level, left image is simulated at 60 mAs current level, corresponding to 20% difference in dose level and a 10% difference in standard deviation.
Figure 6
Figure 6
Plot of p values computed from chi-square test for one row of air scan data at 300 effective mAs. Minimum measured p value is 5.2728*10−4. Fisher’s method analysis indicated the p values are uniformly distributed with a pX value of 0.54.
Figure 7
Figure 7
(a) Plot of reciprocal of variance (proportional to incident flux on object) determined by air scan (points), with its corresponding fitted curve (line). (b) Bowtie filter profile obtained by normalizing fitted variance curve, shown for body (solid) and head (dotted) protocols.
Figure 8
Figure 8
Inverse of measured variance in air region outside objects scanned with tube-current modulation enabled. Line represents scaled tube current, open markers are the simulated and solid markers are real scans. (a) Skull scan with tube modulation on for 250 mAs (lower) and both simulated and original 50 mAs (upper), (b) a patient body scan.
Figure 9
Figure 9
The effect of various components on noise. Conditions are the same as Fig. 2, with solid line representing complete noise model fit to experimental data (dots). The dotted lines present the model with and without inclusion of bowtie filter profile and system noise. For uniform flux with no additive system noise, the model profile would be a constant for all detectors. The bowtie profile contributes rising noise away from the isocenter, while system noise increases noise primarily in the center of the cylinder.
Figure 10
Figure 10
Simulated images created by including a bowtie filter (left) and without one (right), with noise levels matched in the center of the image. Note appearance of noise levels in indicated regions. The percentage difference between two simulations is 1.8% in ROI No. 1 (center), 2.8% in ROI No. 2 (lung), 50.9% in ROI No. 3 (tissue-periphery), 44.6% in ROI No. 4 (tissue-periphery), and 28.3% ROI No. 5 (air-periphery).
Figure 11
Figure 11
Plot of fraction of low-dose images correctly identified vs the amount of additional current in one of the image pair. Data for five individual observers are presented with dotted lines, and solid line represent mean of all observers. The JND point (75% correct) for the mean of all observers is approximately 25% added current, while the JNDs for individual observers vary between 20% and 40% added current.
Figure 12
Figure 12
Plot of real vs simulated image-domain noise (standard deviation in HU) for cadaver head (31 slices as shown in Fig. 3) and cylinder phantom (11 slices as shown in Fig. 4), with a total of more than 2000 ROI. The correlation factor of all data points is r=0.999 28; with r=0.998 49 for cylinder measurements, and r=0.9988 for cadaver head, respectively.

References

    1. Kalender W. A., Computed Tomography: Fundamentals, System Technology, Image Quality, Applications, 2nd ed. (Publicis MCD Verlag, Munich, Germany, 2005).
    1. Brenner D. J. and Hall E. J., “Computed tomography—An increasing source of radiation exposure,” N. Engl. J. Med. NEJMAG 357(22), 2277–2284 (2007). - PubMed
    1. Frush D. P., Donnelly L. F., and Rosen N. S., “Computed tomography and radiation risks: what pediatric health care providers should know,” Pediatrics PEDIAU 112(4), 951–957 (2003). - PubMed
    1. Russell T. D. and Van Metter R. L., “Computer simulations demonstrating factors that influence the quality of radiographic images,” Radiology RADLAX 173, 471 (1989).
    1. Saunders R. S. and Samei E., “A method for modifying the image quality parameters of digital radiographic images,” Med. Phys. MPHYA610.1118/1.1621870 30(11), 3006–3017 (2003). - DOI - PubMed

Publication types

MeSH terms