. 2009 Mar;238(3):656-63.
doi: 10.1002/dvdy.21892.

Automated image-based phenotypic analysis in zebrafish embryos

Affiliations

Automated image-based phenotypic analysis in zebrafish embryos

Andreas Vogt et al. Dev Dyn. 2009 Mar.

Abstract

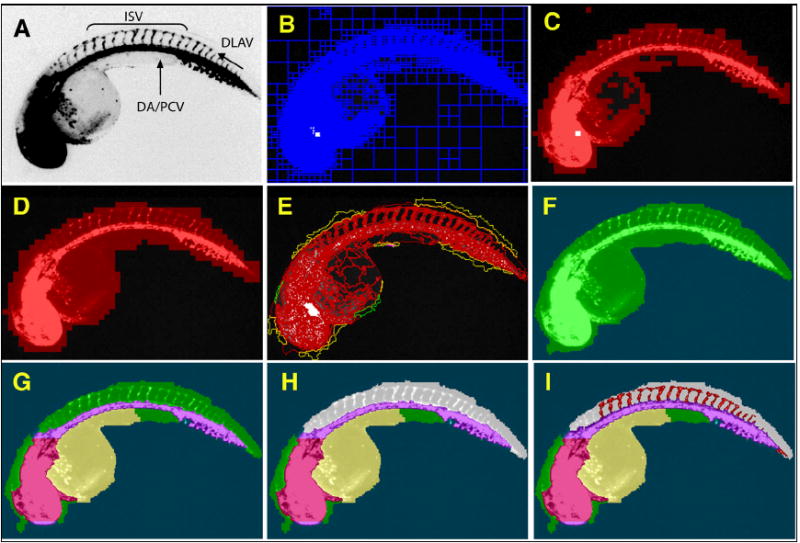
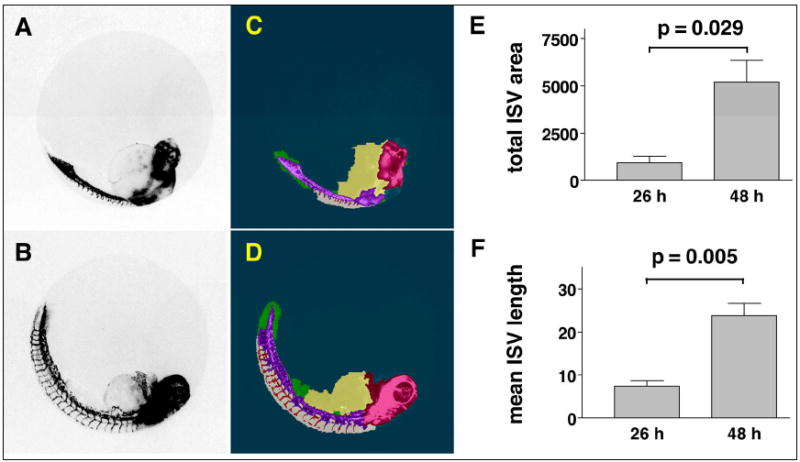
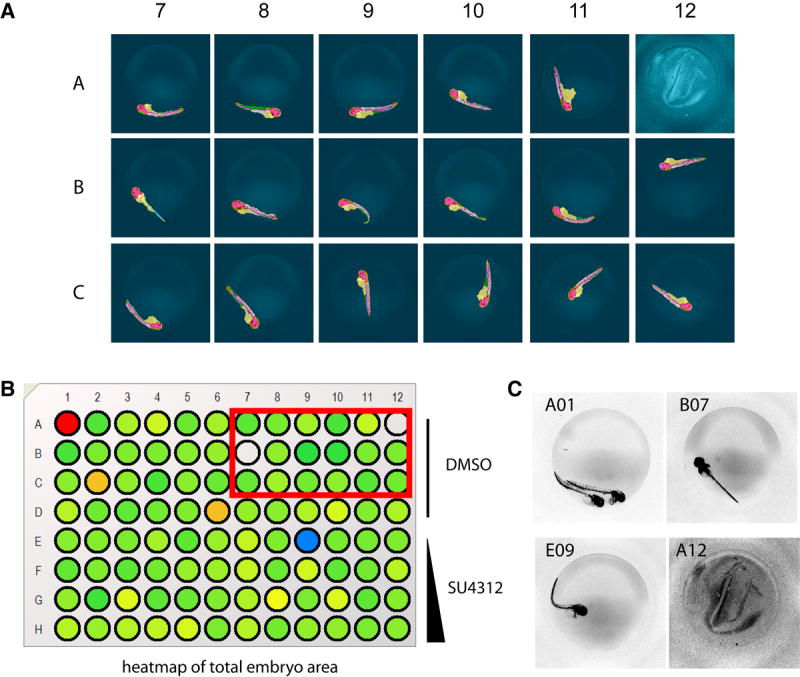
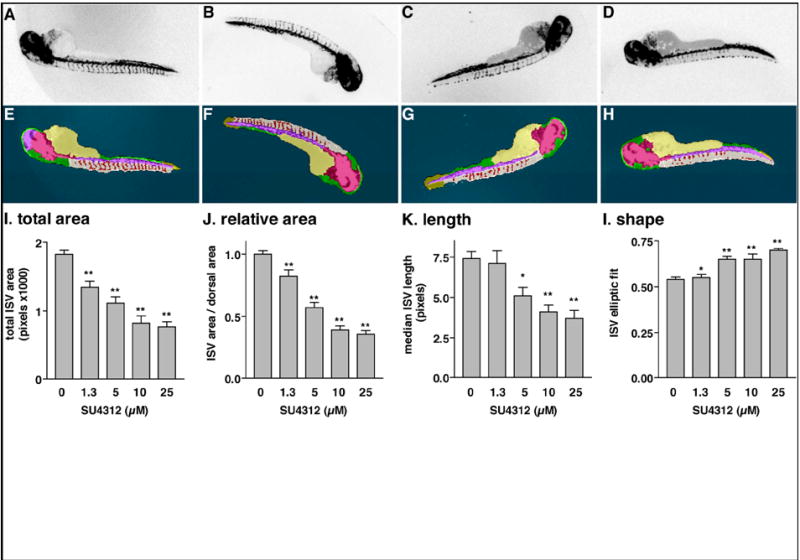
Presently, the zebrafish is the only vertebrate model compatible with contemporary paradigms of drug discovery. Zebrafish embryos are amenable to automation necessary for high-throughput chemical screens, and optical transparency makes them potentially suited for image-based screening. However, the lack of tools for automated analysis of complex images presents an obstacle to using the zebrafish as a high-throughput screening model. We have developed an automated system for imaging and analyzing zebrafish embryos in multi-well plates regardless of embryo orientation and without user intervention. Images of fluorescent embryos were acquired on a high-content reader and analyzed using an artificial intelligence-based image analysis method termed Cognition Network Technology (CNT). CNT reliably detected transgenic fluorescent embryos (Tg(fli1:EGFP)(y1)) arrayed in 96-well plates and quantified intersegmental blood vessel development in embryos treated with small molecule inhibitors of anigiogenesis. The results demonstrate it is feasible to adapt image-based high-content screening methodology to measure complex whole organism phenotypes.


Figures

Fig. 1
Fig. 1. Successive assembly of a hierarchical network identifies ISV in Tg(fli1:EGFP)y1 embryos
48 hpf Tg(fli1:EGFP)y1 zebrafish embryos were imaged on an ArrayScan II high-content reader equipped with a 1.25x objective. The original image (A) was segmented based on pixel intensities and regional variability (B). Regions of high variability (C) were fused and expanded to provide a general outline (D). The outline was refined (E) to demarcate the whole zebrafish embryo (F). Specific subdomains within the embryo such as head, dorsal aorta/posterior cardinal vein, yolk (G), and dorsal area (H, grey) were then assigned through successive interactive loops of locally specific segmentation and classification, resulting in a hierarchical structure of the entire embryo with its subdomains. Knowledge generated during each prior classification step enabled the ruleset to specifically quantify ISV in the dorsal tail (I, red) without interference from other fluorescent regions. (DA), Dorsal aorta; (PCV), posterior cardinal vein; (ISV), intersegmental vessels; and (DLAV), dorsal longitudinal anastomotic vessel.
Fig. 2
Fig. 2. Quantitation of ISV at two distinct developmental stages
Tg(fli1:EGFP)y1 zebrafish embryos were imaged on the ArrayScan II and analyzed. (A, B) Fluorescence micrographs showing sprouting of ISV at 26 hpf and 48 hpf. (C, D) Images with CNT applied. (E, F) The ruleset detected ISV in the dorsal tail at each developmental stage and provided numerical measurements of ISV development. Data are the average ISV length or total area ± s.e.m. from four embryos per condition. Units of measurement are in pixels. p-values were calculated by two-tailed Student’s t-test.
Fig. 3
Fig. 3. Analysis of Tg(fli1:EGFP)y1 zebrafish embryos in multi-well plates
Tg(fli1:EGFP)y1 zebrafish embryos were treated at 24 hpf with vehicle or test agents and kept in medium for an additional 24 h. Embryos were removed from their chorions, placed in the wells of a 96-well microplate and imaged on the ArrayScan II. (A) Selected well micrographs with CNT applied, red box in (B), of vehicle-treated embryos illustrate positioning variations and plate-loading artifacts. Most embryos presented in lateral view and in those cases the CNT ruleset correctly detected the embryo, large vessels, ventral and dorsal areas, and quantified ISV. (B, C) Total embryo size measurements provided an option to tag or eliminate wells containing artifacts due to erroneous loading (A01, A12), dorsal view presentation (B07) or toxicity (E09). Rows A-D, DMSO control; Rows E-H, 1.25 μM, 5 μM, 10 μM, and 25 μM SU4312, respectively.
Fig. 4
Fig. 4. Quantitation of ISV in Tg(fli1:EGFP)y1 embryos treated with a known antiangiogenic agent
Embryos were treated at 24 hpf with vehicle (DMSO) (A) or the indicated concentrations of SU4312, a VEGF receptor antagonist (B) 1.25 μM, (C) 5 μM, (D) 25 μM. After an additional 24 h, dechorionated embryos were transferred to a 96-well plate, scanned on the ArrayScan II, and analyzed with the CNT ruleset. (A-D) Archived, inverted fluorescence images from the plate scan. (E-H) Images with CNT analysis applied. At lower concentrations (B, C), SU4312 caused a partial inhibition phenotype that was difficult to unambiguously assign by visual inspection. (I-L) Quantitative measurements of ISV. The ruleset delivered graded responses for area, length, and shape. IC50 values of SU4312 were consistent for all four readouts. Data in (I–L) were normalized to vehicle-treated controls. Graphs represent the averages ± s.e.m. of at least three independent experiments (n=12, except for vehicle n=45). Statistical analysis was performed by one-way ANOVA followed by Dunnett’s multiple comparison test. *, p < 0.05; **, p < 0.01.
Fig. 5
Fig. 5. Quantitation of ISV in Tg(fli1:EGFP)y1 embryos treated with microtubule-perturbing agents
Two microtubule perturbing agents, 2-methoxyestradiol (2-OMe E2) and (−)-pironetin (structure shown), inhibited ISV growth with IC50 values of 7.0 μM and 0.75 μM, respectively. Data were normalized to vehicle-treated controls. Each data point represents the average percent of control ± s.e.m. of three independent experiments (n=8 per condition).
Fig. 6
Fig. 6. Assay performance under potential screening conditions
Four 96 well plates were loaded with DMSO or SU4312-treated embryos as shown in Supplemental Table 1 and analyzed with the CNT ruleset. The percentage of dorsal area that was occupied by ISV was exported and data points averaged over the four replicates. The quadruplicate design eliminated all plate loading errors, errors due to orientation, toxicity, or fluorescence intensity, as well as ruleset failures (random errors). There was a clear separation between positive (yellow data points) and negative (purple data points) controls, and all active compound test wells (blue data points with red circles) were correctly identified from the collection of unknowns (blue data points). The assay had a signal-to-background ratio of 2.6, and COVs of 14%, 33%, and 16% for minimum, maximum, and unknowns, respectively.

Similar articles

Cited by

References

    1. Belleri M, Ribatti D, Nicoli S, Cotelli F, Forti L, Vannini V, Stivala LA, Presta M. Antiangiogenic and vascular-targeting activity of the microtubule-destabilizing trans-resveratrol derivative 3,5,4’-trimethoxystilbene. Mol Pharmacol. 2005;67:1451–1459. - PubMed
    1. Belotti D, Vergani V, Drudis T, Borsotti P, Pitelli MR, Viale G, Giavazzi R, Taraboletti G. The microtubule-affecting drug paclitaxel has antiangiogenic activity. Clin Cancer Res. 1996;2:1843–1849. - PubMed
    1. Biberthaler P, Athelogou M, Langer S, Luchting B, Leiderer R, Messmer K. Evaluation of murine liver transmission electron micrographs by an innovative object-based quantitative image analysis system (Cellenger) Eur J Med Res. 2003;8:275–282. - PubMed
    1. Binning G, Baatz M, Klenk J, Schmidt G. Will machines start to think like humans? Europhysics News. 2002;33:45–53.
    1. Brideau C, Gunter B, Pikounis B, Liaw A. Improved statistical methods for hit selection in high-throughput screening. J Biomol Screen. 2003;8:634–647. - PubMed

Publication types

MeSH terms

Substances

LinkOut - more resources