. 2009 Feb 24;3(2):307-16.
doi: 10.1021/nn800551s.

Targeted killing of cancer cells in vivo and in vitro with EGF-directed carbon nanotube-based drug delivery

Affiliations

Targeted killing of cancer cells in vivo and in vitro with EGF-directed carbon nanotube-based drug delivery

Ashwin A Bhirde et al. ACS Nano. .

Abstract

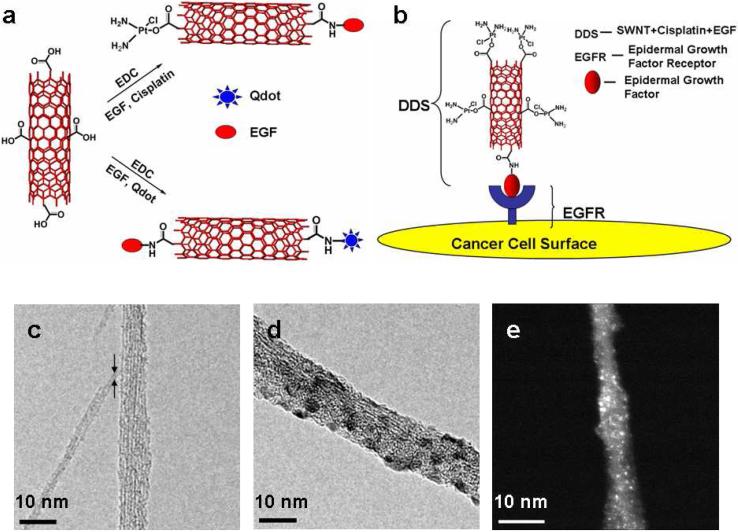
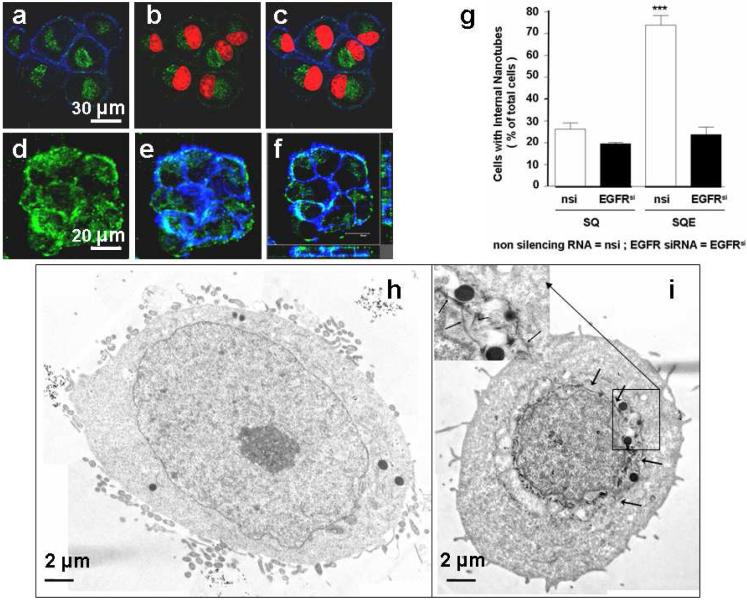
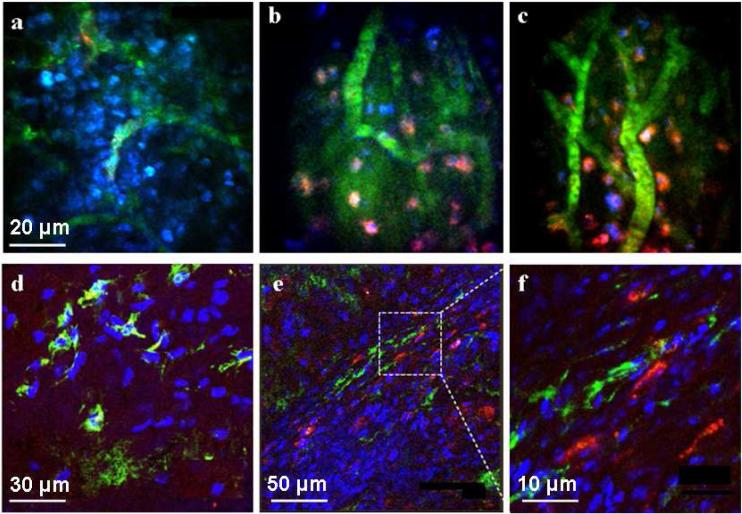
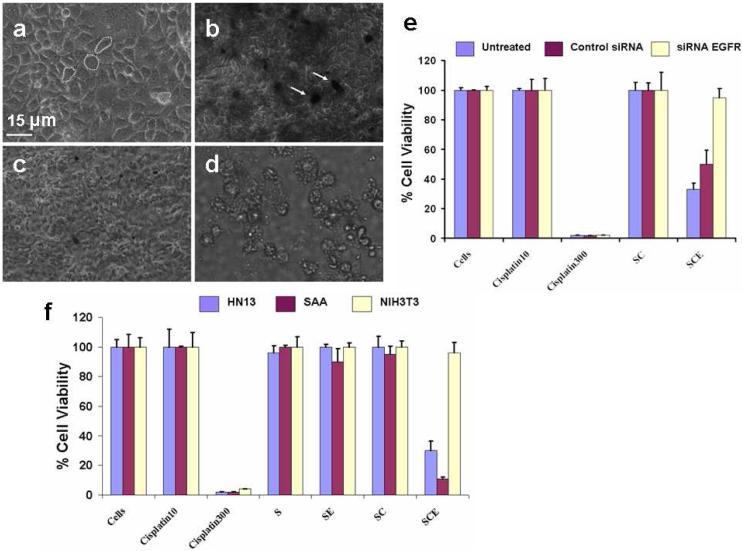
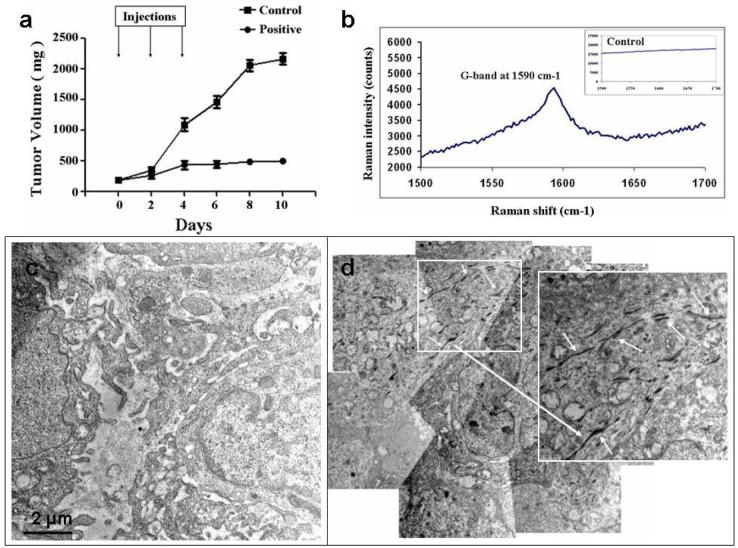
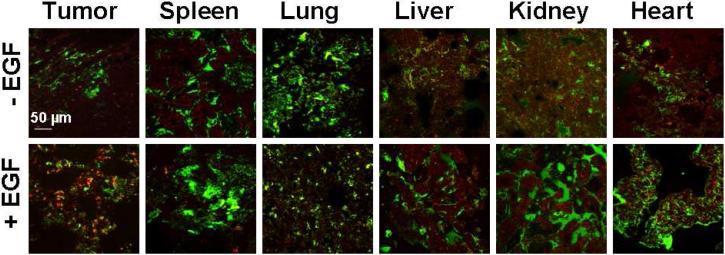
Carbon nanotube-based drug delivery holds great promise for cancer therapy. Herein we report the first targeted, in vivo killing of cancer cells using a drug-single wall carbon nanotube (SWNT) bioconjugate, and demonstrate efficacy superior to nontargeted bioconjugates. First line anticancer agent cisplatin and epidermal growth factor (EGF) were attached to SWNTs to specifically target squamous cancer, and the nontargeted control was SWNT-cisplatin without EGF. Initial in vitro imaging studies with head and neck squamous carcinoma cells (HNSCC) overexpressing EGF receptors (EGFR) using Qdot luminescence and confocal microscopy showed that SWNT-Qdot-EGF bioconjugates internalized rapidly into the cancer cells. Limited uptake occurred for control cells without EGF, and uptake was blocked by siRNA knockdown of EGFR in cancer cells, revealing the importance of EGF-EGFR binding. Three color, two-photon intravital video imaging in vivo showed that SWNT-Qdot-EGF injected into live mice was selectively taken up by HNSCC tumors, but SWNT-Qdot controls with no EGF were cleared from the tumor region in <20 min. HNSCC cells treated with SWNT-cisplatin-EGF were also killed selectively, while control systems that did not feature EGF-EGFR binding did not influence cell proliferation. Most significantly, regression of tumor growth was rapid in mice treated with targeted SWNT-cisplatin-EGF relative to nontargeted SWNT-cisplatin.


Figures

Figure 1
Figure 1. Nanotube Based Delivery System
(A) Illustration of chemical reactions used to attach EGF, cisplatin and Qdots onto carboxylated SWNTs (in red) using EDC as the coupling agent. (B) Schematic showing SWNT bundles bioconjugated with EGF and cisplatin targeting the cell surface receptor EGFR on a single HNSCC cell. Transmission electron micrographs of (c) oxidized SWNT bundles with arrows showing a single SWNT (d) SWNT-Qdot-EGF bioconjugate bundle (e) STEM image of SWNT bundle showing cisplatin as the bright spots. (scale bar = 10 nm)
Figure 2
Figure 2. Cellular internalization and selective uptake of SWNT-Qdot525-EGF by HN13 cells
(a-c) Z-section micrographs of interiors of cells treated with SWNT-Qdot525-EGF (SQE) bioconjugates and analyzed by confocal microscopy: (a) images show the fluorescence of SQE (green) inside the cells and within the outer boundary limits of membrane as judged by actin stained by phalloidin (blue); (b) nuclei are illuminated with propidium iodide (red), and Qdots are seen in close proximity (green); (c) overlay of (a) and (b) showing internalization of SQE around the perinuclear region. (Scale bar 30 µm). 3D reconstitutions of confocal z-sections recapitulate the localization of Qdots (green) and within the periphery of actin fibers (blue) proximal to the cell membrane. (d, e) Z-stacked images showing (d) nanotube-Qdot color only; (e) with nanotube-Qdot and cell membrane colors; (f) three dimensional reconstruction of panel (e) in xyz format. On the right is shown the z-stack going upwards from the x axis; on the left is shown the z-stack going upwards from the y axis. (Scale bars 20 µm). (g) Quantification of results here and in Supporting Figure S4 demonstrates that when the bioconjugate includes EGF and the cells retain high EGFR expression levels, the cells have the largest amount of bioconjugate internalization. The label EGFRsi means treatment with active siRNA to knockdown EGFR. T-tests indicated significant differences between control/SQE and the other samples at p<0.05 using ANOVA (***). (h and i) Cells incubated with SQ or SQE and subsequently washed and subjected to TEM: (h) cells exposed to SQ only, no features resembling internalized nanotubes detected; (i) cells treated with SQE show dark cylindrical structures resembling nanotubes (indicated by arrows) around the perinuclear region, presumably internalized bundles of SWNTs, the inset shows a higher magnification image with nanotubes indicated by arrows. Scale bars are 2 µm.
Figure 3
Figure 3. Detection of Nanotube Bioconjugates in Tumors in vivo
Representative frames from time-lapse videos acquired by 3-color, intravital two-photon microscopy (a-c). Mice bearing the HN12 xenografts were anesthetized and treated with SQ or SQE (red) bioconjugates. Cell nuclei were stained with Höechst (blue) and blood vessels with 500 kDa FITC-dextran (green): For SQ alone with no EGF (a), very little or no red fluorescence representing the Qdot signal was detected within the tumor mass 45 min after injection. Two different views after administration of SQE giving red fluorescence 45 min post injection within the tumor microenvironment (b,c). The red SQE bioconjugate is localized in close proximity to the nuclei suggesting its internalization by the tumor cells within the xenograft. (Scale bar in a-c is 20 µm). Confocal microscopy images of fixed xenograft cryosections (d-f) In the SQ treated tumor sections (d), only Höechst stained cell nuclei (blue) and vascular FITC-labeled dextran (green) are visible (scale bar 30 µm). (e) In SQE treated mice, characteristic red fluorescence was widely distribution within the tumor microenvironment. (scale bar 50 µm). (f) Magnified dotted region of (e) showing internalized SEQ bioconjugates the cells within the tumor mass. (scale bar 10 µm).
Figure 4
Figure 4. Selective killing of cancer cells using SWNT bioconjugates
(a-d) Optical micrographs showing targeting killing of HN13 cells with SWNT-cisplatin-EGF (SCE): (a) cells before treatment, which adhered to the plate and attached to each other with structural morphology intact; (b) cells treated with SCE for 10 min, before washing; dark regions are those with nanotubes present; (c) cells washed with PBS and resuspended in cell culture media DMEM after 10 min incubation with SEC; (d) HN13 cells (treated with SCE for 10 mins and washed) after 12 hours, cells appear floating detached from each other and the plate. (e-f) Cell viability studies, (e) viability comparisons using cell proliferation assay after 12 hr for normal HN13 cells, and HN13 cells transfected with EGFR knockdown and control (no knockdown, labeled “Untreated”) siRNA. Cells-normal growth control. Cisplatin10 - cells treated with 10 µM free cisplatin. Cisplatin300 - incubated with 300 mM free cisplatin. SC - incubated with SWNT-Cisplatin and washed with PBS after 10 min. SCE- incubated with SWNT-cisplatin-EGF (1.3 µM cisplatin) then washed with PBS after 10 min. (f) Cell viability comparisons using cell proliferation assay after 12 hr for normal HN13 cells, with NIH3T3 and SAA mouse fibroblast cells. Cells-normal growth untreated: Cisplatin10 - cells treated with 10 µM free cisplatin. Cisplatin300 - incubated with 300 μM free cisplatin. S - incubated with SWNTs 10 min. SE - incubated with SWNT-EGF and washed with PBS after 10 min. SC - incubated with SWNT-Cisplatin and washed with PBS after 10 min. SCE-incubated with SWNT-Cisplatin-EGF (1.3 µM cisplatin) then washed with PBS after 10 min.
Figure 5
Figure 5. Inhibition of pre-established HN12 HNSCC tumor growth by SWNT-Cisplatin-EGF bioconjugates
The nanotube bioconjugates injected intravenously through the tail vein and observed for the tumor progression (a) plot showing the tumor progression with time (error bars represent S. E. M., n=3); (b) Raman spectra of cryosection of positive tumor tissue (c) and (d) Montage of transmission electron micrograms of fixed tumor sections of mice treated with control and positive. Inset at higher magnification on the right shows the nanotubes very clearly as pointed out by the white arrows. Scale bar = 2 µm.
Figure 6
Figure 6. Analysis of the Distribution of Nanotube bioconjugatesin vivo
Vital organs from tumor-bearing mice injected with Höechst, FITC-dextran, then treated with either SQ or SQE, were removed, frozen, cryosectioned, fixed, and processed for confocal microscopy. Tumor tissues indicate increased uptake of bioconjugates, shown in red, only when EGF was on the nanotubes. Spleen, liver, kidney and heart show some red fluorescence characteristic of the SWNT-Qdots irrespective of the presence or absence of EGF. The pixel intensities were further analyzed for relative quantification of SQ or SQE levels within the different tissues (See supporting Figure S17). Scale bar is 50 µm.

References

    1. Ferrari M. Cancer nanotechnology: Opportunities and Challenges. Nat. Rev. Cancer. 2005;5:161–171. - PubMed
    1. Moses M, Brem H, Langer R. Advancing the Field of Drug Delivery: Taking Aim at Cancer. Cancer Cell. 2003;4:337–341. - PubMed
    1. Singha R, Kim GJ, Nie S, Shin DM. Nanotechnology in Cancer Therapeutics: Bioconjugated Nanoparticles for Drug Delivery. Mol. Cancer Ther. 2006;5:1909–1917. - PubMed
    1. Allen T, Cullis P. Drug Delivery Systems: Entering the Mainstream. Science. 2004;303:1818–1822. - PubMed
    1. Moghimi SM, Hunter AC, Murray JC. Long-Circulating and Target-Specific Nanoparticles: Theory to Practice. Pharmacol Rev. 2001;53:283–318. - PubMed

Publication types

MeSH terms