. 2009 Mar;10(2):201-12.
doi: 10.1111/j.1364-3703.2008.00520.x.

Genome characterization of Pyrenophora tritici-repentis isolates reveals high plasticity and independent chromosomal location of ToxA and ToxB

Affiliations

Genome characterization of Pyrenophora tritici-repentis isolates reveals high plasticity and independent chromosomal location of ToxA and ToxB

R Aboukhaddour et al. Mol Plant Pathol. 2009 Mar.

Abstract

The fungus Pyrenophora tritici-repentis (Died.) causes tan spot, an important leaf disease of wheat worldwide. Isolates of this pathogen have been collected and characterized into eight races on the basis of their ability to produce three different host-selective toxins. The karyotype of 47 isolates was determined by pulsed field gel electrophoresis. The collection originated from different parts of the world and included genotypes from all races. A single isolate was characterized for each of races 3, 4 and 6, whereas fourteen, five, nine, five and eleven isolates were karyotyped for races 1, 2, 5, 7 and 8, respectively. The survey showed that the chromosome number of P. tritici-repentis was highly variable, with some isolates having as few as eight chromosomes, but others having 11 or more. Similarly, the genome size ranged from 25.5 to 48.0 Mb, and individual chromosome sizes ranged from 1.3 to more than 5.7 Mb. Considerable variation was observed in karyotype patterns among the P. tritici-repentis isolates tested. A total of 29 different karyotypes was identified among the 47 isolates. These chromosome level variations were as variable for isolates within a race as for isolates across races. Southern blot analysis of the 47 isolates with ToxA and ToxB probes revealed that the toxin genes were always located on different chromosomes. Furthermore, with six chromosome-specific single-copy probes, the ToxA-carrying chromosome was shown to be homologous among the Ptr ToxA-producing isolates, with a related chromosome in the non-ToxA-producing isolates, suggesting that the chromosome on which ToxA generally resides is of an essential nature. Interestingly, a molecular rearrangement involving a translocation of ToxA to a different chromosome was identified in one isolate.


Figures
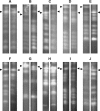
Figure 1
Figure 1
Ten independent chromosomal preparations of the same isolates, using two different single‐spore‐derived cultures and separated on different gels, are displayed side by side, demonstrating the consistency of the karyotyping methods. (A) I‐17‐2; (B) 17‐10; (C) I‐17‐11; (D) I‐35‐5; (E) I‐35‐14; (F) I‐35‐35; (G) I‐73‐1; (H) ALG4‐X1; (I) ALGH2; (J) ASC1. Black arrows on the side of each panel point to the 5.7‐Mb chromosome.
Figure 2
Figure 2
Diagram representing the 29 karyotypes of the 47 Pyrenophora tritici‐repentis isolates analysed. Karyotypes 1–29 are indicated on top, races 1–8 are marked below. Molecular sizes (Mb) are on the left. Co‐migrating chromosomes are drawn as thicker bands. Chromosomal bands hybridizing to ToxA and ToxB are denoted by A and B, respectively, above the chromosomal band. *K8 karyotype occurs for race 1 and 2 isolates, but is only shown among race 1. **ToxA and ToxB appear to locate on the same band in K27.
Figure 3
Figure 3
Densitometric measurements of isolate I‐73‐1 chromosomal bands separated by pulsed field gel electrophoresis (PFGE) using standard separation conditions as well as conditions to preferentially resolve larger chromosomes. (A) Separation under standard conditions and densitometric analysis of the separated chromosomes show higher density bands in the 3.5–5.7‐Mb range, indicative of unresolved co‐migrating chromosomes. The numbers beside the peaks indicate the relative intensity of each band. The numbers beside the bands represent the estimated number of co‐migrating chromosomes based on the densitometric values. (B) Enhanced view of isolate I‐73‐1 resolved side‐by‐side with the molecular standard Schizosaccharomyces pombe. The separation conditions were the same as in (A). (C) Improved resolution of isolate I‐73‐1 large chromosomes using modified electrophoresis conditions (2 V; 1200–1800 s; 72 h) clearly shows the presence of multiple chromosomes in the 3.5–5.7‐Mb range. Resolved bands are indicated by arrows, and brackets indicate the corresponding 3.5–5.7‐Mb range. Corresponding fragments between (B) and (C) are marked by joined lines.
Figure 4
Figure 4
Electrophoretic karyotype of seven isolates of Pyrenophora tritici‐repentis and identification of the chromosomes that carry ToxA and ToxB. (A) Pulsed field gel electrophoresis (PFGE) was performed using the conditions described previously (Zhong et al., 2002). The isolates are labelled on top of the lanes and the karyotypes are in parentheses. The molecular standards Hansenula wingei and Schizosaccharomyces pombe are shown in the first and last lane, respectively. Molecular sizes (Mb) are indicated on the left. Hybridization with ToxA (B) and ToxB (C) shows that the two genes are located on different chromosomes.
Figure 5
Figure 5
Electrophoretic karyotype and Southern blot analysis of Pyrenophora tritici‐repentis isolate I‐73‐1 under different separation conditions. (A) Contour‐clamped homogeneous electric field (CHEF) gel (left) and Southern blot with ToxA (middle) and ToxB (right) of isolate I‐73‐1 (lane 1) and Schizosaccharomyces pombe (lane 2). Separation conditions: 2 V, 1200–960 s, 24 h; followed by 2.5 V, 960–480 s, 96 h. (B) CHEF gel (left) and Southern blot with ToxA (middle) and ToxB (right) of isolate I‐73‐1 (lane 1) and S. pombe (lane 2). Separation conditions: 2 V, 1200–1800 s, 72 h.
Figure 6
Figure 6
Diagram representing the location of ToxA and the chromosome‐specific single‐copy probes (P1–P6), and their physical distance on chromosome 6 of isolate Pt‐1C‐BFP (Pyrenophora tritici‐repentis Sequencing Project, Broad Institute of Harvard and Massachusetts Institute of Technology, Cambridge, MA, USA; http://www.broad.mit.edu). The numbers above the arrows indicate the distance from ToxA in base pairs.
Figure 7
Figure 7
Occurrence of the chromosome‐specific probe (P1) in Pyrenophora tritici‐repentis ToxA‐producing and ToxA‐non‐producing isolates. For each pair of images from A to F, the left lane represents the contour‐clamped homogeneous electric field (CHEF) gel and the right lane represents the Southern blot with probe P1 for ASC1, I‐35‐28, I‐35‐35, I‐35‐5, ALG4‐X1 and SC29‐1, respectively. (G) CHEF gel (left) and Southern blot with P1 (middle) and with ToxA probe (right) for isolate I‐73‐1. Standard separation conditions (2 V, 1200–960 s, 24 h; followed by 2.5 V, 960–480 s, 96 h) were used in all the above isolates, except for SC29‐1 (2 V, 1200–1800 s, 27 h).

References

    1. Anderson, J.A. , Effertz, R.J. , Faris, J.D. , Francl, L.J. , Meinhardt, S.W. and Gill, B.S. (1999) Genetic analysis of sensitivity to Pyrenophora tritici‐repentis necrosis‐inducing toxin in durum and common wheat. Phytopathology, 89, 293–297. - PubMed
    1. Andrie, R.M. , Schoch, C.L. , Hedges, R. , Spatafora, J.W. and Ciuffetti, L.M. (2007) Homologs of ToxB, a host‐selective toxin gene from Pyrenophora tritici‐repentis, are present in the genome of sister‐species Pyrenophora bromi and other members of the Ascomycota. Fungal Genet. Biol. 45, 363–377. - PubMed
    1. Ballance, G.M. , Lamari, L. , Kowatsch, R. and Bernier, C.C. (1996) Cloning expression and occurrence of the gene encoding the Ptr necrosis toxin from Pyrenophora tritici‐repentis . Mol. Plant Pathol . On‐line http://www.bspp.org.uk/mppol/1996/1209ballance.
    1. Bockus, W.W. and Classen, M.M. (1992) Effects of crop rotation and residue management practices on severity of tan spot of winter wheat. Plant Dis. 76, 633–636.
    1. Brasier, C.M. (1987) The dynamics of fungi In: Evolutionary Biology of Fungi (Rayner A.D.M., Brasier C.M. and Moore D., eds), pp. 231–260. Cambridge: Cambridge University Press.

Publication types

LinkOut - more resources