. 2009 Aug;28(8):1296-307.
doi: 10.1109/TMI.2009.2014863. Epub 2009 Feb 20.

Unified framework for robust estimation of brain networks from FMRI using temporal and spatial correlation analyses

Affiliations

Unified framework for robust estimation of brain networks from FMRI using temporal and spatial correlation analyses

Yongmei Michelle Wang et al. IEEE Trans Med Imaging. 2009 Aug.

Abstract

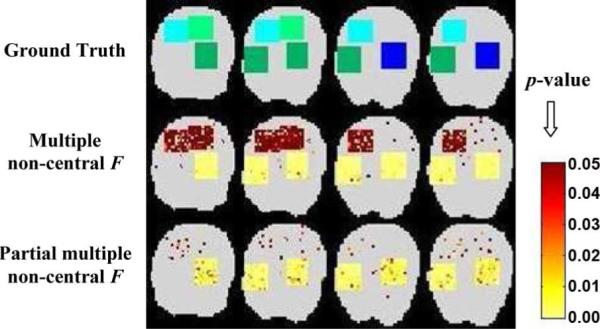
There is a rapidly growing interest in the neuroimaging field to use functional magnetic resonance imaging (fMRI) to explore brain networks, i.e., how regions of the brain communicate with one another. This paper presents a general and novel statistical framework for robust and more complete estimation of brain functional connectivity from fMRI based on correlation analyses and hypothesis testing. In addition to the ability of examining the correlations with each individual seed as in the standard and existing methods, the proposed framework can detect functional interactions by simultaneously examining multiseed correlations via multiple correlation coefficients. Spatially structured noise in fMRI is also taken into account during the identification of functional interconnection networks through noncentral F hypothesis tests. The associated issues for the multiple testing and the effective degrees-of-freedom are considered as well. Furthermore, partial multiple correlations are introduced and formulated to measure any additional task-induced but not stimulus-locked relation over brain regions so that we can take the analysis of functional connectivity closer to the characterization of direct functional interactions of the brain. Evaluation for accuracy and advantages, and comparisons of the new approaches in the presented general framework are performed using both realistic synthetic data and in vivo fMRI data.


Figures

Fig. 1
Fig. 1
Configuration diagram for the P seed regions and a random voxel X.
Fig. 2
Fig. 2
(a) Ground truth of a simulated seed. (b) Normalized time series of an associated connectivity voxel at SNR = −0.5 dB. (c) ROC curves at SNR (in dB) = 0.0, −0.5, −1.0, −1.5 (top to bottom).
Fig. 3
Fig. 3
Identified functional connectivity (color maps) for simulated data (SNR = −1.0 dB): Comparison of our multiseed method (multiple correlation) and the single-seed method (with spatial noise considered, too).
Fig. 4
Fig. 4
Comparison of ROC curves for our multiseed method (solid lines with circles) and the single-seed method (with spatial noise also considered, dashed lines) at different SNRs, showing significantly improved performance using multiple seeds. Note: The TPR and FPR for the single-seed case are computed as below: M is the total number of voxels; Let i = 1, 2 be the seed index. Suppose: ni (i = 1, 2) is the number of voxels correctly detected as significant; Ni (i = 1, 2) is the number of voxels with added type i connectivity; mi (i = 1, 2) is the number of voxels incorrectly detected as significant. Therefore, the combined TPR and FPR used in the ROC plots for the single-seed case are: TPR = (n1 + n2)/(N1 + N2) and FPR = (m1 + m2)/(MN1N2)
Fig. 5
Fig. 5
Identified functional connectivity (color maps) for simulated data (SNR = −1.0 dB): Comparison of our multiseed methods using multiple and partial multiple correlations.
Fig. 6
Fig. 6
Structural model for the dorsal visual stream (modified from [35]), including primary visual cortex (V1), visual cortical area MT (V5), posterior parietal cortex (PP), and modulatory interaction term involving dorsolateral pre-frontal cortex (PFC).
Fig. 7
Fig. 7
Spatial location of the activation regions identified from SPM5 for a single subject real fMRI data.
Fig. 8
Fig. 8
Estimated correlograms from the real fMRI data, showing the asymptotic correlation, ρ, in ρθ(h) (marginal correlation) is lower than the one in ρθ(h)(h) (partial correlation). This might be related to the fact that a baseline condition of brain function exhibits decreases during performance of a cognitive task [41].
Fig. 9
Fig. 9
Comparison and results of functional interaction maps for the real fMRI data. (a) Seeds: Left and right VI. (b) Seeds: Left and right V5. (c) Seeds: Right V1 and Right V5.

Similar articles

Cited by

References

    1. Horwitz B. The elusive concept of brain connectivity. NeuroImage. 2003;19:466–470. - PubMed
    1. Friston KJ, Frith CD, Liddle PF, Frackowiak RSJ. Functional connectivity: The principal-component analysis of large (PET) data sets. J. Cerebral Blood Flow Metabolism. 1993;13:5–14. - PubMed
    1. Worsley KJ, Chen J-I, Lerch J, Evans AC. Comparing connectivity via thresholding correlations and SVD. Phil. Trans. R. Soc. 2005;360:913–920. - PMC - PubMed
    1. Hampson M, Peterson BS, Skudlarski P, Gatenby JC, Gore JC. Detection of functional connectivity using temporal correlations in MR images. Human Brain Mapp. 2002;15:247–262. - PMC - PubMed
    1. Rombouts SARB, Stem CJ, Kuijer JPA, Scheltens Ph., Barkhof F. Identifying confounds to increase specificity during a “no task condition:” evidence for hippocampal connectivity using fMRI. NeuroImage. 2003;20:1236–1245. - PubMed