

Carbohydrate sensing in the human mouth: effects on exercise performance and brain activity
- PMID: 19237430
- PMCID: PMC2683964
- DOI: 10.1113/jphysiol.2008.164285
Carbohydrate sensing in the human mouth: effects on exercise performance and brain activity
Abstract
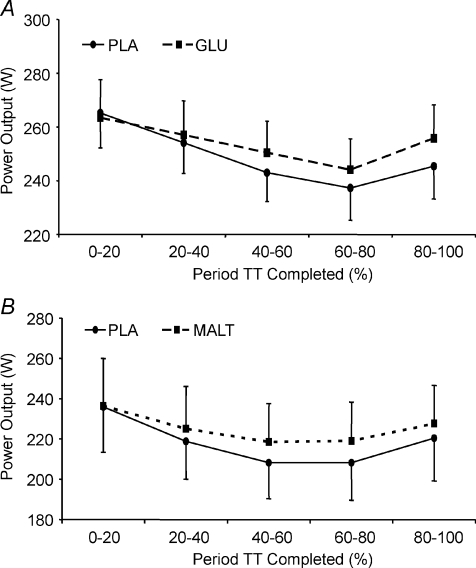
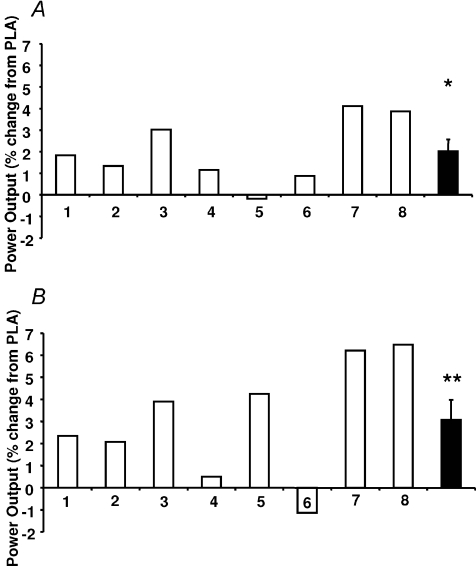
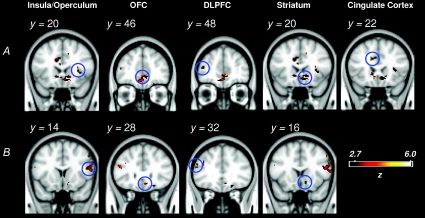
Exercise studies have suggested that the presence of carbohydrate in the human mouth activates regions of the brain that can enhance exercise performance but direct evidence of such a mechanism is limited. The first aim of the present study was to observe how rinsing the mouth with solutions containing glucose and maltodextrin, disguised with artificial sweetener, would affect exercise performance. The second aim was to use functional magnetic resonance imaging (fMRI) to identify the brain regions activated by these substances. In Study 1A, eight endurance-trained cyclists (VO2max 60.8 +/- 4.1 ml kg(-1) min(-1)) completed a cycle time trial (total work = 914 +/- 29 kJ) significantly faster when rinsing their mouths with a 6.4% glucose solution compared with a placebo containing saccharin (60.4 +/- 3.7 and 61.6 +/- 3.8 min, respectively, P = 0.007). The corresponding fMRI study (Study 1B) revealed that oral exposure to glucose activated reward-related brain regions, including the anterior cingulate cortex and striatum, which were unresponsive to saccharin. In Study 2A, eight endurance-trained cyclists (VO2max 57.8 +/- 3.2 ml kg(-1) min(-1)) tested the effect of rinsing with a 6.4% maltodextrin solution on exercise performance, showing it to significantly reduce the time to complete the cycle time trial (total work = 837 +/- 68 kJ) compared to an artificially sweetened placebo (62.6 +/- 4.7 and 64.6 +/- 4.9 min, respectively, P = 0.012). The second neuroimaging study (Study 2B) compared the cortical response to oral maltodextrin and glucose, revealing a similar pattern of brain activation in response to the two carbohydrate solutions, including areas of the insula/frontal operculum, orbitofrontal cortex and striatum. The results suggest that the improvement in exercise performance that is observed when carbohydrate is present in the mouth may be due to the activation of brain regions believed to be involved in reward and motor control. The findings also suggest that there may be a class of so far unidentified oral receptors that respond to carbohydrate independently of those for sweetness.
Figures


Comment in
-
Go rinse your mouth: a novel way to improve endurance performance?J Physiol. 2009 Jun 1;587(Pt 11):2425-6. doi: 10.1113/jphysiol.2009.172874. Epub 2009 Mar 30. J Physiol. 2009. PMID: 19332497 Free PMC article. No abstract available.
References
-
- Anantaraman R, Carmines AA, Gaesser GA, Weltman A. Effects of carbohydrate supplementation on performance during 1 hour of high-intensity exercise. Int J Sports Med. 1995;16:461–465. - PubMed
-
- Beckmann CF, Jenkinson M, Smith SM. General multilevel linear modeling for group analysis in FMRI. Neuroimage. 2003;20:1052–1063. - PubMed
-
- Below PR, Mora-Rodriguez R, Gonzalez-Alonso J, Coyle EF. Fluid and carbohydrate ingestion independently improve performance during 1 h of intense exercise. Med Sci Sports Exerc. 1995;27:200–210. - PubMed
-
- Bergstrom J, Hermansen L, Hultman E, Saltin B. Diet, muscle glycogen and physical performance. Acta Physiol Scand. 1967;71:140–150. - PubMed
-
- Berridge KC, Robinson TE. What is the role of dopamine in reward: hedonic impact, reward learning, or incentive salience? Brain Res Brain Res Rev. 1998;28:309–369. - PubMed
MeSH terms
Substances
LinkOut - more resources
Full Text Sources
Medical
Miscellaneous