. 2009 Mar 16;206(3):549-59.
doi: 10.1084/jem.20082394. Epub 2009 Feb 23.

Constitutive ablation of dendritic cells breaks self-tolerance of CD4 T cells and results in spontaneous fatal autoimmunity

Affiliations

Constitutive ablation of dendritic cells breaks self-tolerance of CD4 T cells and results in spontaneous fatal autoimmunity

Caspar Ohnmacht et al. J Exp Med. .

Abstract

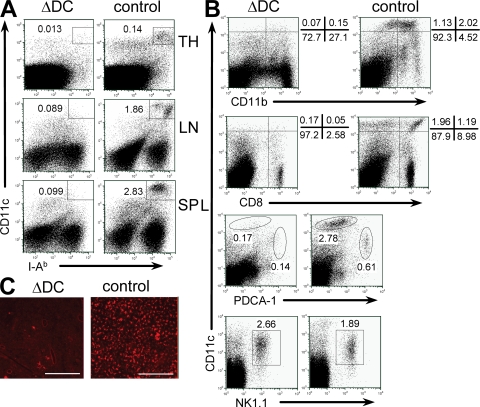
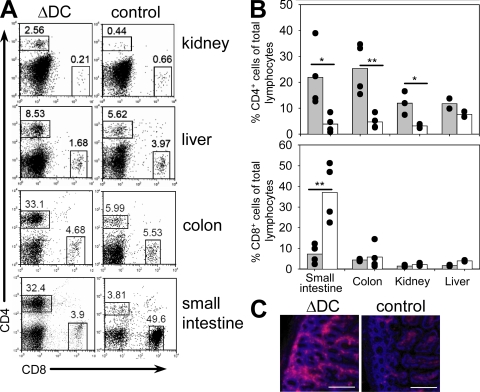
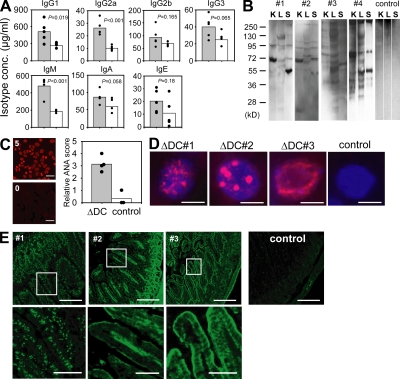
Lack of immunological tolerance against self-antigens results in autoimmune disorders. During onset of autoimmunity, dendritic cells (DCs) are thought to be critical for priming of self-reactive T cells that have escaped tolerance induction. However, because DCs can also induce T cell tolerance, it remains unclear whether DCs are required under steady-state conditions to prevent autoimmunity. To address this question, we crossed CD11c-Cre mice with mice that express diphtheria toxin A (DTA) under the control of a loxP-flanked neomycin resistance (neo(R)) cassette from the ROSA26 locus. Cre-mediated removal of the neo(R) cassette leads to DTA expression and constitutive loss of conventional DCs, plasmacytoid DCs, and Langerhans cells. These DC-depleted (DeltaDC) mice showed increased frequencies of CD4 single-positive thymocytes and infiltration of CD4 T cells into peripheral tissues. They developed spontaneous autoimmunity characterized by reduced body weight, splenomegaly, autoantibody formation, neutrophilia, high numbers of Th1 and Th17 cells, and inflammatory bowel disease. Pathology could be induced by reconstitution of wild-type (WT) mice with bone marrow (BM) from DeltaDC mice, whereas mixed BM chimeras that received BM from DeltaDC and WT mice remained healthy. This demonstrates that DCs play an essential role to protect against fatal autoimmunity under steady-state conditions.


Figures

Figure 1.
Figure 1.
Efficiency of DC depletion in ΔDC mice. (A) Single cell suspensions of thymus (TH), spleen (SP), and mesenteric LN from ΔDC and control mice were stained for CD11c and MHC class II (I-Ab). (B) Staining of DC subsets in the spleen of ΔDC or control mice. Dot plots are gated on Gr-1 cells. The CD11c versus NK1.1 plots are additionally gated on B220+ cells. (C) Epithelial layers of the ears of indicated mice were stained for I-Ab to detect Langerhans cells. Original magnification was 80×. The results are representative of two to three independent experiments. Bars, 300 µm.
Figure 2.
Figure 2.
Impaired immune response in ΔDC mice. (A) Frequency of OT-II cells in the spleen after adoptive transfer and before (open bars) or 4 d after (filled bars) MVA-OVA immunization of ΔDC or control mice. Pooled results are from two separate experiments. n = 4; *, P < 0.028. (B) Transferred OT-II cells (Thy1.1+) are less activated (CD62Lneg) in ΔDC as compared with control mice. (C) Kinetics of expansion of Kb-OVA257-264 pentamer-specific CD8 T cells in ΔDC mice (open circles) or controls (filled circles) after immunization with MVA-OVA. n = 3 ΔDC mice and 2 controls. Error bars show SD. (D) Dot plots are gated on CD8+ cells and show staining of Kb-OVA257-264 pentamers versus CD62L. (E) Number of adult worms in the small intestine of four ΔDC mice or controls on day 10 after N. brasiliensis infection from two independent experiments. The filled circles show worm counts from individual mice. The bars show the means. (F) Frequency of CD4 T cells (CD4+Siglec-F) and eosinophils (CD4Siglec-F+) in dispersed total lung tissue of ΔDC mice and controls. Dot plots are representative of four mice per group.
Figure 3.
Figure 3.
T cell development in ΔDC mice. (A and B) Frequency of SP thymocytes in ΔDC mice (filled bars) compared with controls (open bars). Pooled results are from three independent experiments. n = 6; *, P = 0.001. The filled circles show results from individual mice. The bars show the means. (C) Flow cytometric analysis of thymocytes from indicated BM chimeras. (D) Frequency of Vβ3+, Vβ11+, Vβ12+, and Vβ2+ cells among CD4 SP thymocytes from 5-wk-old ΔDC mice (filled bars) or R-DTA control mice (open bars) relative to C57BL/6 controls. Pooled results are from two independent experiments. n = 3; *, P = 0.01. (E) Frequency of T reg cells in the thymus of ΔDC or control mice. Dot plots are gated on CD4+CD8 thymocytes and representative of two independent experiments.
Figure 4.
Figure 4.
Phenotypic characterization of ΔDC mice. (A) Body weight of ΔDC mice (filled circles) and controls (open circles) between 4 and 15 wk of age. n = 3–6 per time point. Error bars show SD. (B) Survival of ΔDC mice (thick line; n = 12) and controls (thin line; n = 10). (C) Size of spleen (SP), inguinal LN (ILN), and mesenteric LN (MLN) of indicated mice on a metric scale. (D) Picture of an 8-wk-old ΔDC mouse and a negative littermate demonstrating splenomegaly, intestinal inflammation, and lack of the fat pad in the ΔDC mouse. The green line indicates the small intestine and the blue line indicates the large intestine. SP, spleen; FP, fat pad. (E) Histology of tissue sections from indicated organs from 8-wk-old ΔDC or control mice demonstrating cellular infiltrates in tissues from ΔDC mice. Bars, 400 µm. The experiment has been repeated with similar results.
Figure 5.
Figure 5.
Expansion of Gr-1+ cells in ΔDC mice. (A) Cell counts of indicated populations in the spleen of 6–8-wk-old ΔDC mice (filled bars) or controls (open bars). Pooled results are from four independent experiments. n = 3–5; *, P = 0.02; **, P = 0.001. (B) Body weight and number of Gr-1+ cells in the spleen of ΔDC→WT (hatched gray bars) or ΔDC + WT→WT (hatched white bars) BM chimeras. Pooled results are from two independent experiments. n = 3–5; *, P = 0.001; **, P = 0.011. The filled circles show results from individual mice. The bars show the means.
Figure 6.
Figure 6.
Phenotype of T cells in ΔDC mice. (A) Frequency of activated (CD44hiCD62Llo) T cells in the spleen of indicated mice. Bars show the mean frequency of activated T cells from 6–8-wk-old ΔDC mice (filled bars) or control mice (open bars). Pooled results are from three independent experiments. n = 5; *, P = 0.0003. (B and C) Intracellular cytokine staining of PMA/ionomycin restimulated CD4 T cells and CD25/Foxp3 staining of untreated CD4 T cells isolated from mesenteric LNs (B) or peripheral organs (C) of indicated mice. Bars show the mean frequency of indicated T cell subsets. Pooled results are from three independent experiments. n = 4; *, P = 0.02; **, P = 0.01. The filled circles show results from individual mice.
Figure 7.
Figure 7.
Infiltration of CD4 T cells in peripheral organs. (A and B) Frequency of CD4 and CD8 T cells in indicated organs of 6–8-wk-old ΔDC or control mice. Pooled results are from four independent experiments. n = 4; *, P < 0.05; **, P < 0.01. The filled circles show results from individual mice. The bars show the means. (C) Immunofluorescent analysis of CD4 T cell infiltrations in the lamina propria of the small intestine of indicated mice. Bars, 200 µm.
Figure 8.
Figure 8.
Hyperimmunoglobulinemia and autoantibodies in ΔDC mice. (A) Immunoglobulin isotype concentrations in the serum of ΔDC mice (filled bars) or controls (open bars). n = 5 from two independent experiments. (B) Western blot analysis showing the staining pattern of autoantibodies present in the serum of four individual ΔDC mice and one control on total cell extracts of kidney (K), liver (L), and spleen (S) from Rag-deficient mice. (C) ANAs were scored between 0 (negative control serum from WT mice) and 5 (positive control serum from MRL/lpr mice) by determining the staining intensity on Hep2 cells. Filled bar, serum from ΔDC mice; open bar, serum from control mice. Bars, 10 µm. The filled circles show results from individual mice. The bars show the means. (D) Different staining pattern of nuclear structures by ANAs (red) from three individual ΔDC mice and a negative littermate control on liver sections from Rag-deficient mice. DAPI staining is shown in blue. Original magnification was 480×. Bars, 5 µm. (E, top) Staining pattern of autoantibodies from three individual ΔDC mice (#1–3) and a negative littermate on sections from the small intestine of Rag-deficient mice. Bars, 200 µm. (E, bottom) Magnified view of the areas indicated in the top. Bars, 40 µm.

References

    1. Anderson G., Moore N.C., Owen J.J., Jenkinson E.J. 1996. Cellular interactions in thymocyte development.Annu. Rev. Immunol. 14:73–99 - PubMed
    1. Gallegos A.M., Bevan M.J. 2004. Central tolerance to tissue-specific antigens mediated by direct and indirect antigen presentation.J. Exp. Med. 200:1039–1049 - PMC - PubMed
    1. Laufer T.M., DeKoning J., Markowitz J.S., Lo D., Glimcher L.H. 1996. Unopposed positive selection and autoreactivity in mice expressing class II MHC only on thymic cortex.Nature. 383:81–85 - PubMed
    1. Volkmann A., Zal T., Stockinger B. 1997. Antigen-presenting cells in the thymus that can negatively select MHC class II-restricted T cells recognizing a circulating self antigen.J. Immunol. 158:693–706 - PubMed
    1. McCaughtry T.M., Baldwin T.A., Wilken M.S., Hogquist K.A. 2008. Clonal deletion of thymocytes can occur in the cortex with no involvement of the medulla.J. Exp. Med. 205:2575–2584 - PMC - PubMed

Publication types

MeSH terms