

Long-term trends in myocardial infarction incidence and case fatality in the National Heart, Lung, and Blood Institute's Framingham Heart study
- PMID: 19237656
- PMCID: PMC2725400
- DOI: 10.1161/CIRCULATIONAHA.108.825364
Long-term trends in myocardial infarction incidence and case fatality in the National Heart, Lung, and Blood Institute's Framingham Heart study
Abstract
Background: Whereas the prevalence of coronary heart disease risk factors has declined over the past decades in the United States, acute myocardial infarction (AMI) rates have been steady. We hypothesized that this paradox is due partly to the advent of increasingly sensitive biomarkers for AMI diagnosis.
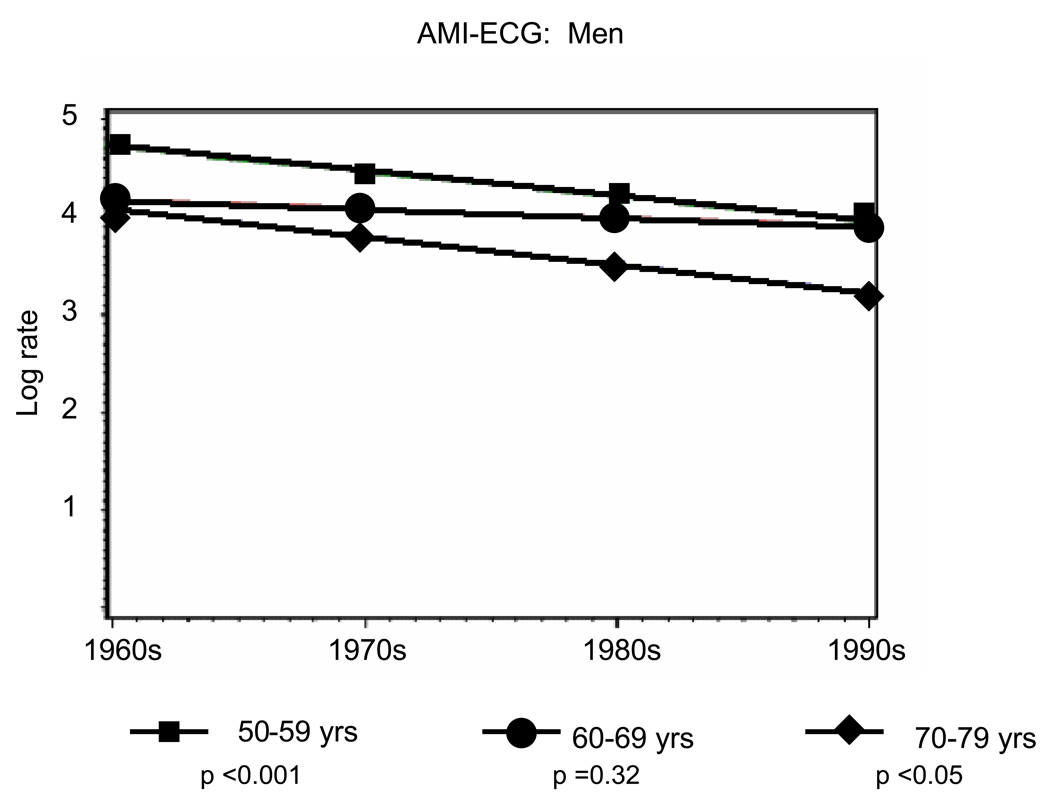
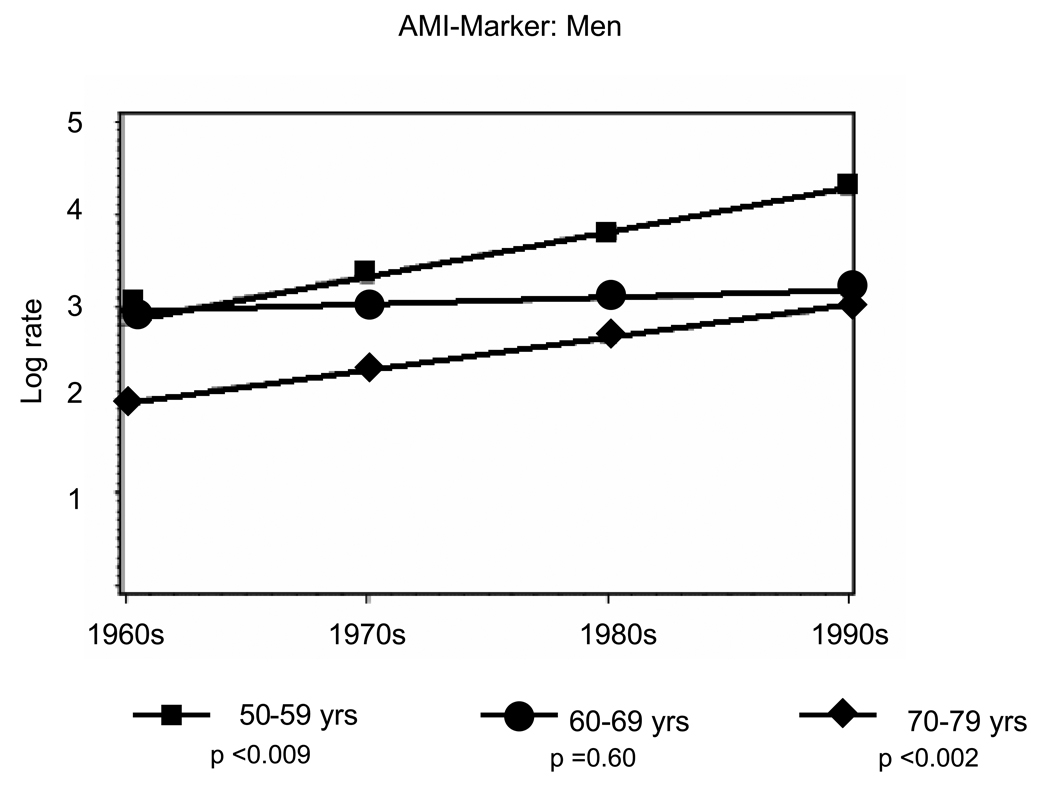
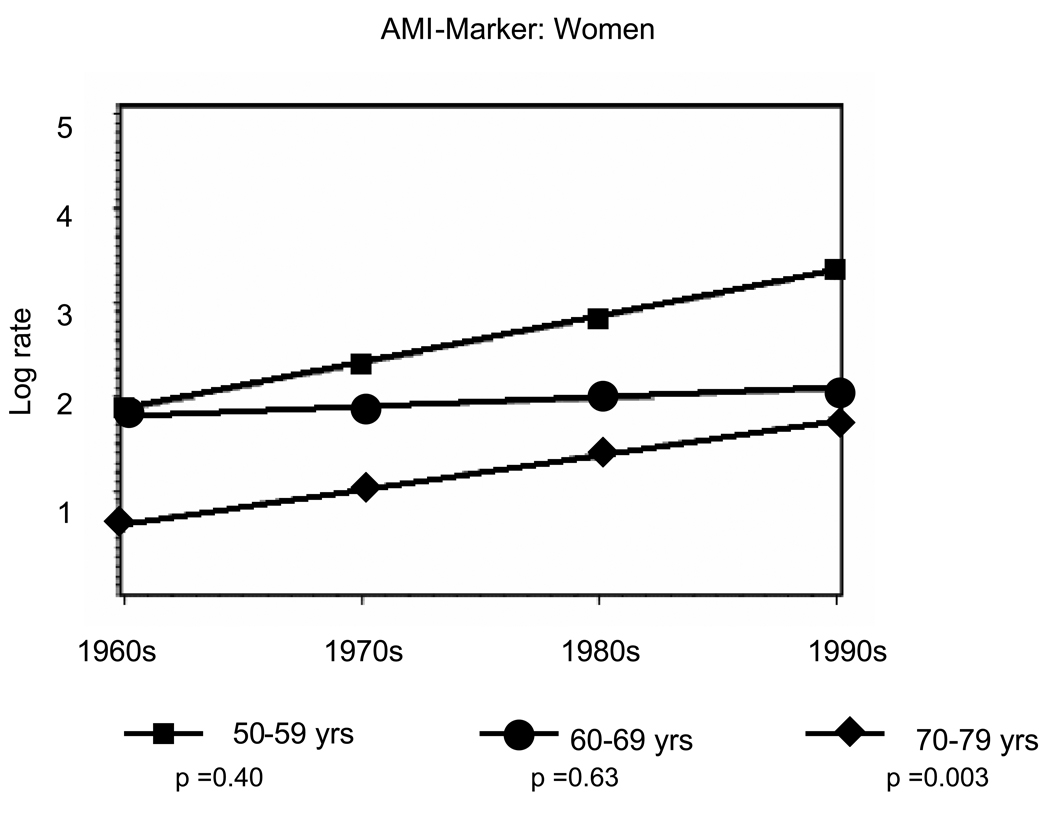
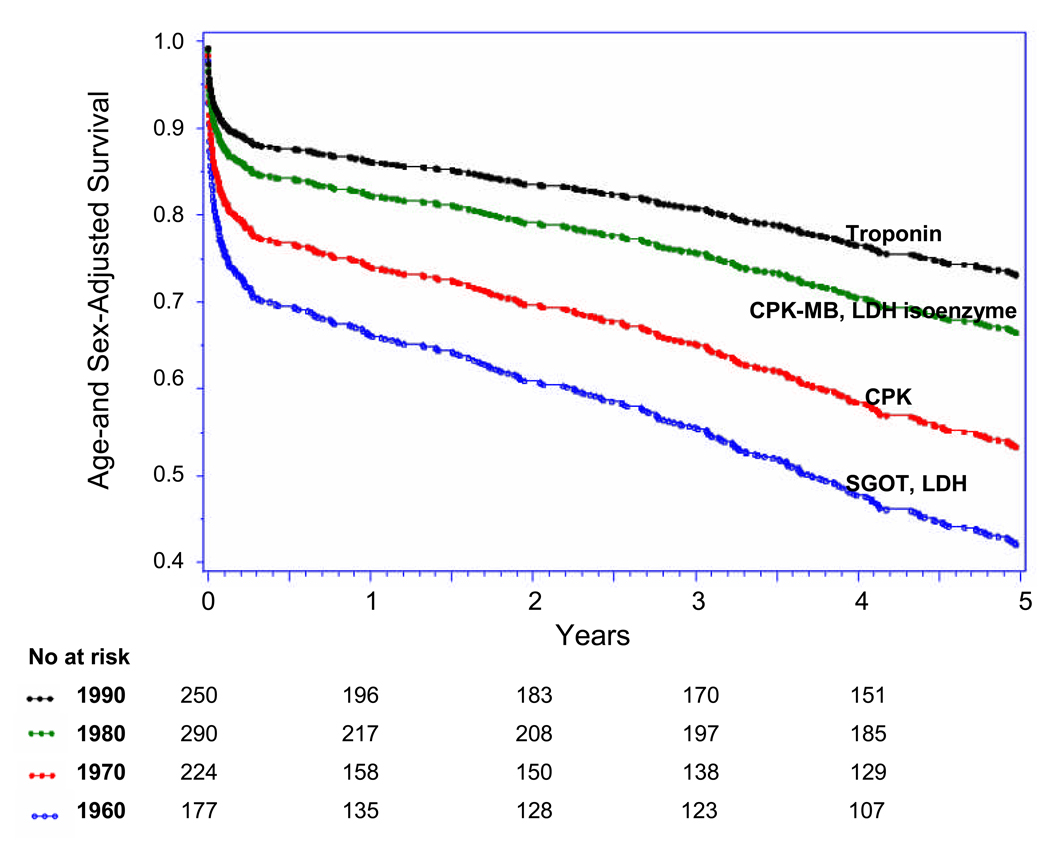
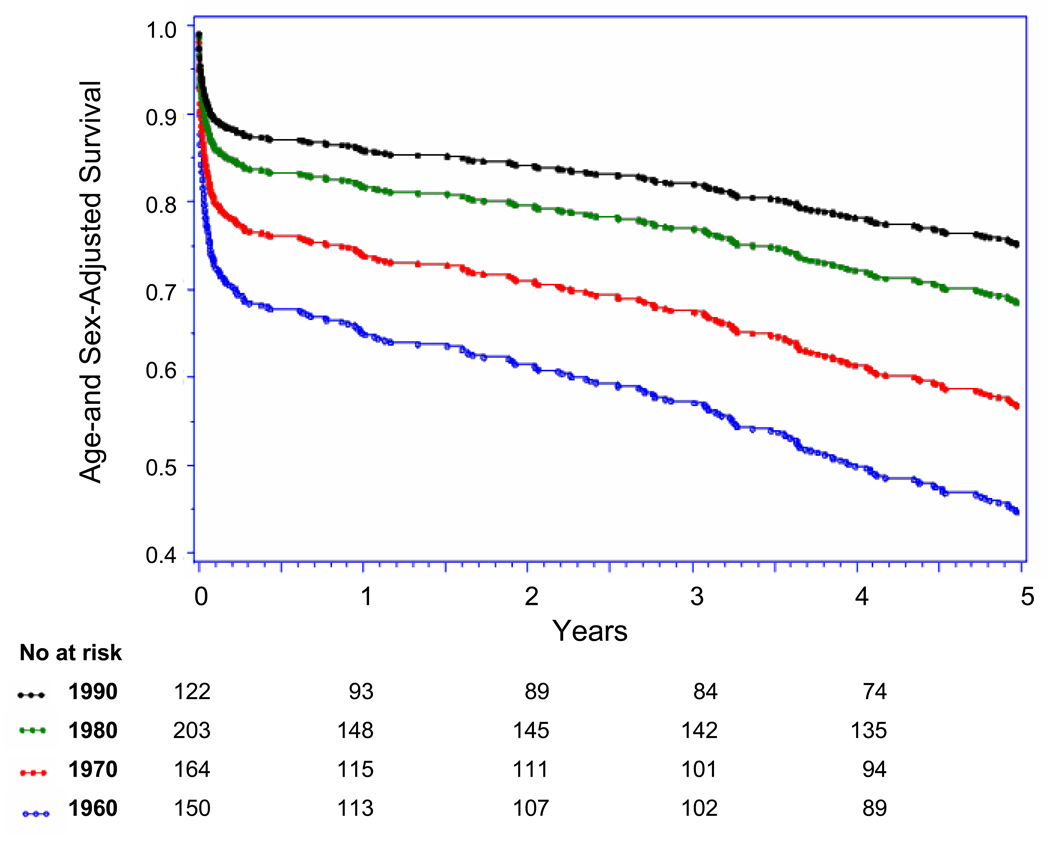
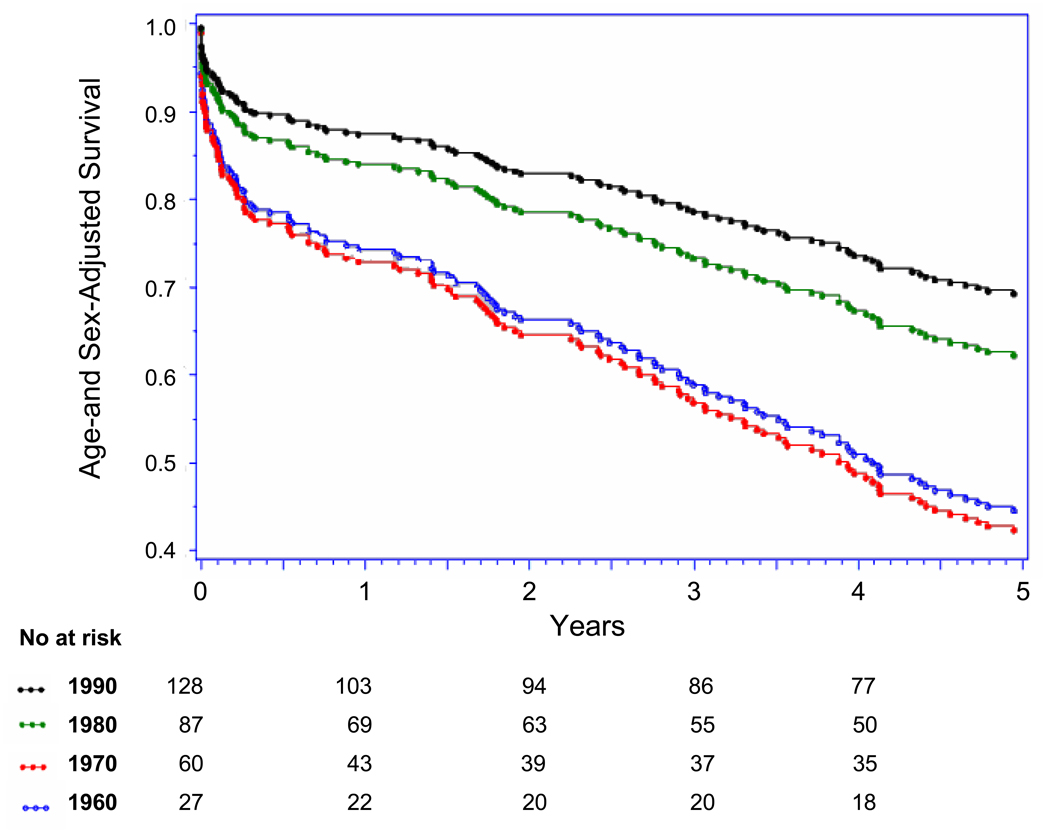
Methods and results: In Framingham Heart Study participants over 4 decades, we compared the incidence and survival rates of initial AMI diagnosis by ECG (AMI-ECG) regardless of biomarkers with those based exclusively on infarction biomarkers (AMI-marker). We used Poisson regression to calculate annual incidence rates of first AMI over 4 decades (1960 to 1969, 1970 to 1979, 1980 to 1989, and 1990 to 1999) and compared rates of AMI-ECG with rates of AMI-marker. Cox proportional-hazards analysis was used to compare AMI case fatality over 4 decades. In 9824 persons (54% women; follow-up, 212 539 person-years; age, 40 to 89 years), 941 AMIs occurred, including 639 AMI-ECG and 302 AMI-marker events. From 1960 to 1999, rates of AMI-ECG declined by approximately 50% and rates of AMI-marker increased approximately 2-fold. Crude 30-day, 1-year, and 5-year case fatality rates in 1960 to 1969 and 1990 to 1999 were 0.20 and 0.14, 0.24 and 0.21, and 0.45 and 0.41, respectively. Age- and sex-adjusted 30-day, 1-year, and 5-year AMI case fatality declined by 60% in 1960 to 1999 (P for trend <0.001), with parallel declines noted after AMI-ECG and AMI-marker.
Conclusions: Over the past 40 years, rates of AMI-ECG have declined by 50%, whereas rates of AMI-marker have doubled. Our findings offer an explanation for the apparently steady national AMI rates in the face of improvements in primary prevention.
Conflict of interest statement
There are no conflicts of interest to disclose.
Figures

Comment in
-
To the Framingham data, turn, turn, turn.Circulation. 2009 Mar 10;119(9):1189-91. doi: 10.1161/CIRCULATIONAHA.108.845545. Epub 2009 Feb 23. Circulation. 2009. PMID: 19237654 No abstract available.
References
-
- NHLBI Morbidity and Mortality Chart Book. 2004
-
- Fox CS, Evans JC, Larson MG, Kannel WB, Levy D. Temporal trends in coronary heart disease mortality and sudden cardiac death from 1950 to 1999: the Framingham Heart Study. Circulation. 2004;110:522–527. - PubMed
-
- Guidry UC, Evans JC, Larson MG, Wilson PW, Murabito JM, Levy D. Temporal trends in event rates after Q-wave myocardial infarction: the Framingham Heart Study. Circulation. 1999;100:2054–2059. - PubMed
-
- Rosamond WD, Chambless LE, Folsom AR, Cooper LS, Conwill DE, Clegg L, Wang CH, Heiss G. Trends in the incidence of myocardial infarction and in mortality due to coronary heart disease, 1987 to 1994. N.Engl.J Med. 1998;339:861–867. - PubMed
-
- Unal B, Critchley JA, Capewell S. Explaining the decline in coronary heart disease mortality in England and Wales between 1981 and 2000. Circulation. 2004;109:1101–1107. - PubMed
Publication types
MeSH terms
Substances
Grants and funding
LinkOut - more resources
Full Text Sources
Medical
Miscellaneous
