. 2009 Mar 10;119(9):1220-30.
doi: 10.1161/CIRCULATIONAHA.108.794834. Epub 2009 Feb 23.

Electrophysiological consequences of dyssynchronous heart failure and its restoration by resynchronization therapy

Affiliations

Electrophysiological consequences of dyssynchronous heart failure and its restoration by resynchronization therapy

Takeshi Aiba et al. Circulation. .

Abstract

Background: Cardiac resynchronization therapy (CRT) is widely applied in patients with heart failure and dyssynchronous contraction (DHF), but the electrophysiological consequences of CRT in heart failure remain largely unexplored.

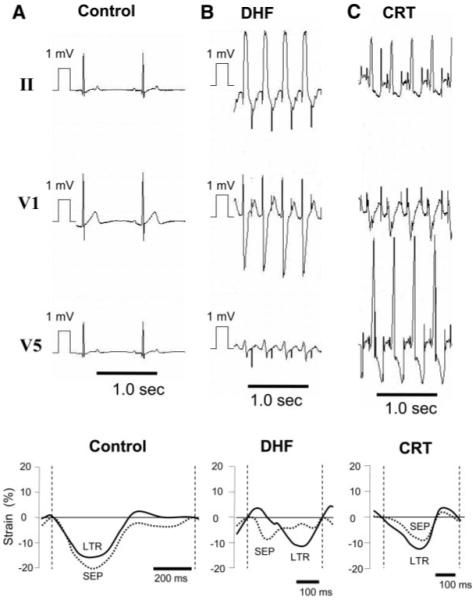
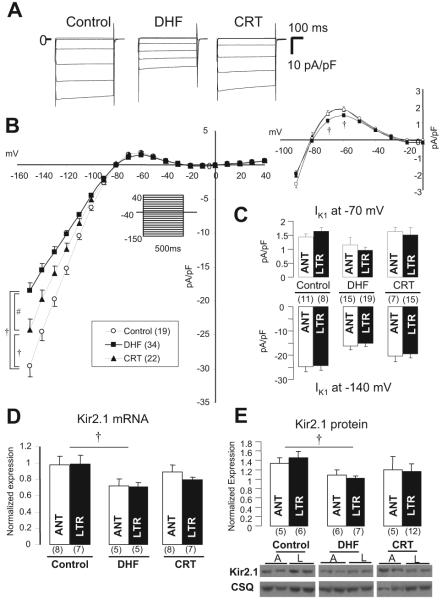
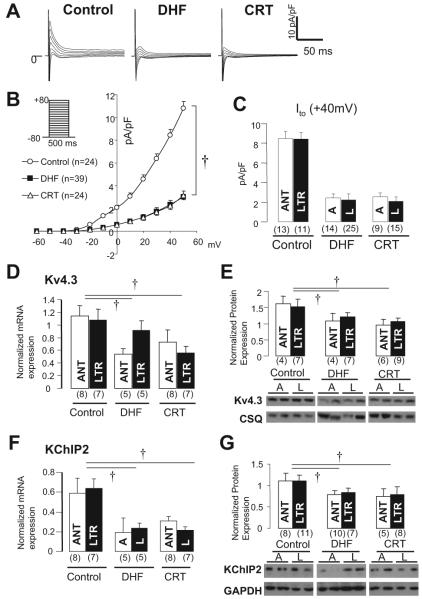
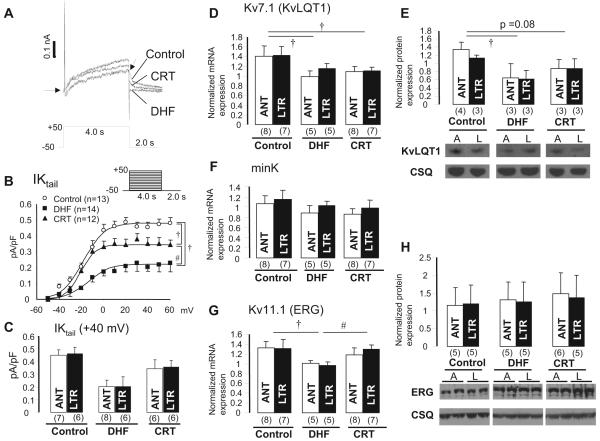
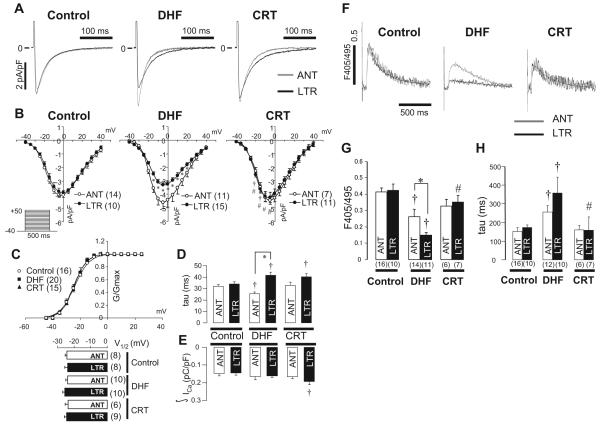
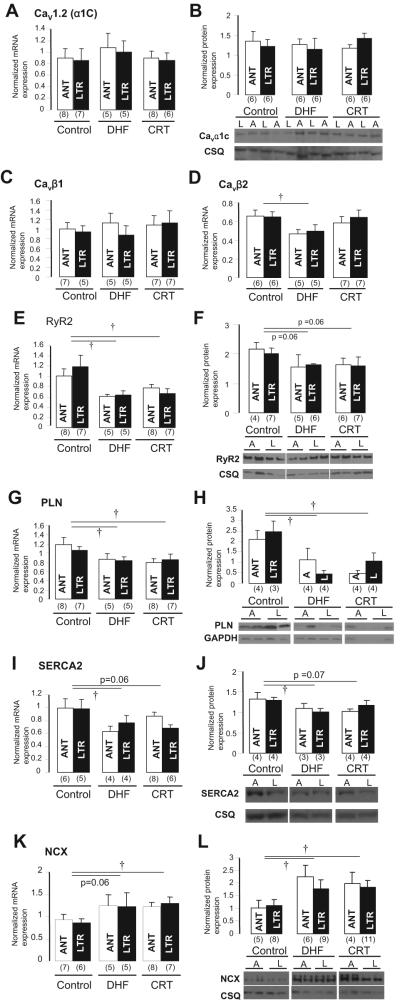
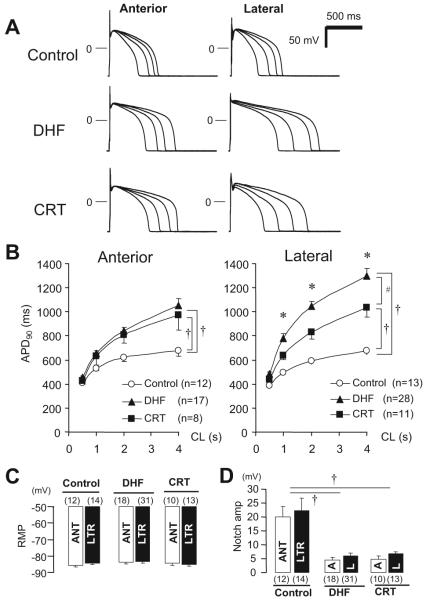
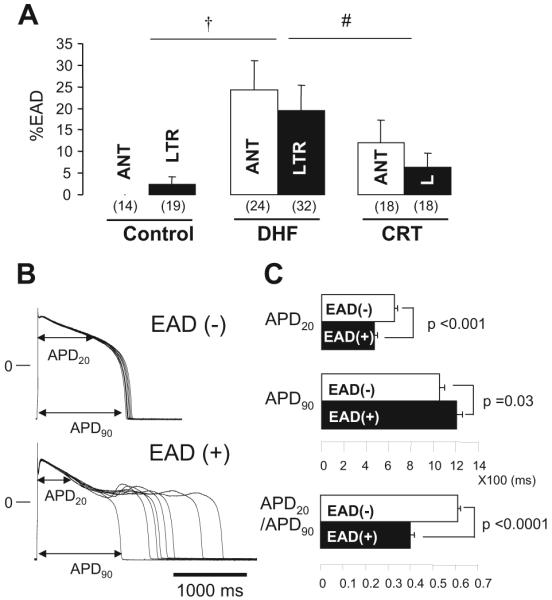
Methods and results: Adult dogs underwent left bundle-branch ablation and either right atrial pacing (190 to 200 bpm) for 6 weeks (DHF) or 3 weeks of right atrial pacing followed by 3 weeks of resynchronization by biventricular pacing at the same pacing rate (CRT). Isolated left ventricular anterior and lateral myocytes from nonfailing (control), DHF, and CRT dogs were studied with the whole-cell patch clamp. Quantitative polymerase chain reaction and Western blots were performed to measure steady state mRNA and protein levels. DHF significantly reduced the inward rectifier K(+) current (I(K1)), delayed rectifier K(+) current (I(K)), and transient outward K(+) current (I(to)) in both anterior and lateral cells. CRT partially restored the DHF-induced reduction of I(K1) and I(K) but not I(to), consistent with trends in the changes in steady state K(+) channel mRNA and protein levels. DHF reduced the peak inward Ca(2+) current (I(Ca)) density and slowed I(Ca) decay in lateral compared with anterior cells, whereas CRT restored peak I(Ca) amplitude but did not hasten decay in lateral cells. Calcium transient amplitudes were depressed and the decay was slowed in DHF, especially in lateral myocytes. CRT hastened the decay in both regions and increased the calcium transient amplitude in lateral but not anterior cells. No difference was found in Ca(V)1.2 (alpha1C) mRNA or protein expression, but reduced Ca(V)beta2 mRNA was found in DHF cells. DHF reduced phospholamban, ryanodine receptor, and sarcoplasmic reticulum Ca(2+) ATPase and increased Na(+)-Ca(2+) exchanger mRNA and protein. CRT did not restore the DHF-induced molecular remodeling, except for sarcoplasmic reticulum Ca(2+) ATPase. Action potential durations were significantly prolonged in DHF, especially in lateral cells, and CRT abbreviated action potential duration in lateral but not anterior cells. Early afterdepolarizations were more frequent in DHF than in control cells and were reduced with CRT.

Conclusions: CRT partially restores DHF-induced ion channel remodeling and abnormal Ca(2+) homeostasis and attenuates the regional heterogeneity of action potential duration. The electrophysiological changes induced by CRT may suppress ventricular arrhythmias, contribute to the survival benefit of this therapy, and improve the mechanical performance of the heart.


Figures

Figure 1
Figure 1
Representative ECGs and changes of LV septal (SEP) and lateral (LTR) strain from control (A), 6-week paced DHF (B), and CRT (C) dogs. ECGs from DHF and CRT dogs are shown during pacing, and control is shown during sinus rhythm. Biventricular pacing synchronized the strain patterns between LV septal and lateral walls and abbreviated the DHF-induced prolongation of QRS duration.
Figure 2
Figure 2
IK1 and Kir2.1 mRNA and protein levels in control, DHF, and CRT. A, Representative current traces in lateral myocytes isolated from control, DHF, and CRT canine ventricles elicited by the diagrammed voltage-clamp protocol (holding potential -40 mV, test pulse 500 ms in duration). B, Steady state current-voltage (I-V) relationship of IK1 and outward current portion of the I-V (right) in each group. The voltage-clamp protocol is shown in the inset. C, IK1 density at -140 and -70 mV in anterior (ANT) and lateral (LTR) myocytes of each group. D and E, Kir2.1 mRNA and protein expression in anterior and lateral myocytes of each group. A or ANT indicates anterior; L or LTR, lateral; and CSQ, calsequestrin. †P<0.05 vs control; #P<0.05 vs DHF. The values in parentheses are the number of cells or tissue samples studied in this and all remaining figures.
Figure 3
Figure 3
Ito, and its underlying subunit mRNA and protein expression in control, DHF, and CRT. A, Representative current traces in lateral myocytes from control, DHF, and CRT ventricles elicited by the voltage-clamp protocol shown in inset. B, Peak current-voltage relationship of Ito in each group. C, Ito density at +40 mV in anterior and lateral myocytes of each group. D through G, Kv4.3 and KChIP2 mRNA and protein expression in LV midmyocardial tissue isolated from control, DHF, and CRT dogs. A or ANT indicates anterior; L or LTR, lateral; and CSQ, calsequestrin. †P<0.05 vs control.
Figure 4
Figure 4
IK and its underlying subunit mRNA and protein expression in control, DHF, and CRT hearts. A, Representative current traces from control, DHF, and CRT myocytes elicited by voltage-clamp protocol shown in the inset. B, Current-voltage relationship of the tail current of IK (IK tail) fitted to the Boltzmann equation: IK,tail=1/{1+exp[(V1/2-Vm)/k]}. Voltage-clamp protocol is shown in the inset. C, IK tail density at 40 mV between anterior and lateral myocytes in each group. D through H, KvLQT1, minK, and ERG mRNA and protein expression in mid myocardium of control, DHF, and CRT dogs. A or ANT indicates anterior; L or LTR, lateral; and CSQ, calsequestrin. †P<0.05 vs control; #P<0.05 vs DHF.
Figure 5
Figure 5
ICa and CaT in control, DHF, and CRT dogs. A, Representative ICa recorded from anterior and lateral myocytes. B, Peak current-voltage relationships for ICa,L in control, DHF, and CRT myocytes. Voltage-clamp protocol is shown in the inset. C, Voltage dependence of ICa activation in control, DHF, and CRT myocytes was fit with a Boltzmann equation of the form G/Gmax=1/[1+exp(V1/2-V)/k]. The voltage at which GCa was half-maximal (V1/2) did not differ among the 3 groups and regions. D, Plot of the time constant of the fast (major) component of current decay measured at 0 mV. E, Plot of the charge carried by ICa during the first 200 ms of the voltage step. F, Representative superimposed CaTs recorded in anterior and lateral myocytes from control, DHF, and CRT dogs stimulated at 0.5 Hz as measured with indo-1 fluorescence. G and H, Average peak fluorescence values and average decay τ of CaT measured at 0.5-Hz stimulation frequency in anterior and lateral myocytes from control, DHF, and CRT dogs. ANT indicates anterior; LTR, lateral. †P<0.05 vs control; #P<0.05 vs DHF by ANOVA; *P<0.05 by t test, anterior vs lateral.
Figure 6
Figure 6
Ca2+ handling-related mRNA and protein expression in control, DHF, and CRT myocytes. A and B, Cav1.2 (α1c) mRNA and protein. C and D, Cavβ1 and Cavβ2 mRNA. E and F, Ryanodine receptor (RyR2) mRNA and protein. G and H, Phospholamban (PLN) mRNA and protein. I and J, SERCA2 mRNA and protein. K and L, Na+-Ca2+ exchanger (NCX) mRNA and protein. A or ANT indicates anterior; L or LTR, lateral; and CSQ, calsequestrin. †P<0.05 vs control.
Figure 7
Figure 7
APD in LV myocytes from control, DHF, and CRT hearts. A, Representative superimposed APs recorded at pacing cycle lengths (CL) of 0.5, 1.0, 2.0, and 4.0 seconds, B, Relationship between pacing CL and APD at 90% recovery (APD90) from anterior and lateral myocytes in each group. C and D, Bar plot of resting membrane potential (RMP; C) and phase 1 notch amplitude (D) at pacing CL of 2.0 seconds. †P<0.05 vs control; #P<0.05 vs DHF; *P<0.05 vs anterior. ANT or A indicates anterior; LTR or L, lateral.
Figure 8
Figure 8
EADs in myocytes from control, DHF, and CRT hearts. A, Bar plot of frequency of EADs (%EADs indicates fraction of APs with EADs). B, Representative superimposed APs recorded in myocytes isolated from lateral wall of DHF hearts with [EAD(+)] or without [EAD(-)] EADs. C, Bar plots of APD20, APD90, and ratio of APD20 to APD90 (APD20/APD90) in failing myocytes. All data were obtained during pacing at 0.25 Hz. †P<0.05 vs control; #P<0.05 vs DHF. ANT or A indicates anterior; LTR or L, lateral.

Comment in

References

    1. Tomaselli GF, Zipes DP. What causes sudden death in heart failure? Circ Res. 2004;95:754–763. - PubMed
    1. Nattel S, Maguy A, Le Bouter S, Yeh YH. Arrhythmogenic ion-channel remodeling in the heart: heart failure, myocardial infarction, and atrial fibrillation. Physiol Rev. 2007;87:425–456. - PubMed
    1. Grines CL, Bashore TM, Boudoulas H, Olson S, Shafer P, Wooley CF. Functional abnormalities in isolated left bundle branch block: the effect of interventricular asynchrony. Circulation. 1989;79:845–853. - PubMed
    1. Spragg DD, Leclercq C, Loghmani M, Faris OP, Tunin RS, DiSilvestre D, McVeigh ER, Tomaselli GF, Kass DA. Regional alterations in protein expression in the dyssynchronous failing heart. Circulation. 2003;108:929–932. - PubMed
    1. Spragg DD, Akar FG, Helm RH, Tunin RS, Tomaselli GF, Kass DA. Abnormal conduction and repolarization in late-activated myocardium of dyssynchronously contracting hearts. Cardiovasc Res. 2005;67:77–86. - PubMed

Publication types

MeSH terms