Comparative Study
. 2008 Sep 16;99(6):966-73.
doi: 10.1038/sj.bjc.6604560.

Reduced expression of a gene proliferation signature is associated with enhanced malignancy in colon cancer

Affiliations
Comparative Study

Reduced expression of a gene proliferation signature is associated with enhanced malignancy in colon cancer

A Anjomshoaa et al. Br J Cancer. .

Abstract

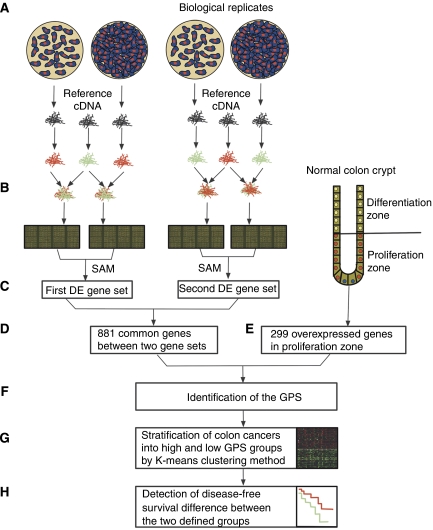
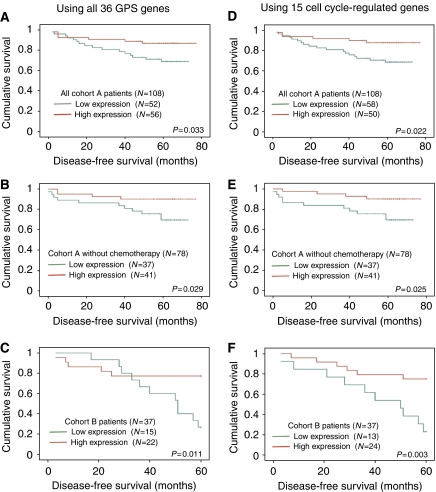
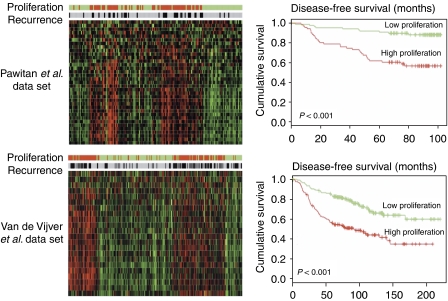
The association between cell proliferation and the malignant potential of colon cancer is not well understood. Here, we evaluated this association using a colon-specific gene proliferation signature (GPS). The GPS was derived by combining gene expression data obtained from the analysis of a cancer cell line model and a published colon crypt profile. The GPS was overexpressed in both actively cycling cells in vitro and the proliferate compartment of colon crypts. K-means clustering was used to independantly stratify two cohorts of colon tumours into two groups with high and low GPS expression. Notably, we observed a significant association between reduced GPS expression and an increased likelihood of recurrence (P < 0.05), leading to shorter disease-free survival in both cohorts. This finding was not a result of methodological bias as we verified the well-established association between breast cancer malignancy and increased proliferation, by applying our GPS to public breast cancer data. In this study, we show that reduced proliferation is a biological feature characterizing the majority of aggressive colon cancers. This contrasts with many other carcinomas such as breast cancer. Investigating the reasons underlying this unusual observation may provide important insight into the biology of colon cancer progression and putative novel therapy options.


Figures

Figure 1
Figure 1
Overview methodology. A gene proliferation signature (GPS) was derived by combining the gene expression data from the analysis of a cell line model and colon crypts. (A) Ten colorectal cancer cell lines were cultured and harvested at semi-confluence and full confluence. Each cell culture was performed in duplicate. (B) Using a reference design, a mixture of sample and reference dye-labelled cDNAs was hybridised to a 30 K Oligo array. Dye orientation was reversed for biological replicates. (C) Statistical analysis of microarrays (SAM) was performed to identify differentially expressed (DE) genes between two stages of growth in cultures. Two gene sets were generated through the analysis of samples with identical dye labelling. (D) Only 881 genes that were presented in both SAM-generated gene sets and DE gene sets were selected. (E) Human colon crypt profiling resulted in identification of 299 DE genes with overexpression in the proliferation zone compared with the differentiation zone. (F) The GPS was generated by taking the overlapping genes between D and E gene sets. (G) Two cohorts of colon cancer patients were stratified into low and high groups according to the GPS expression using K-means clustering method. (H) Disease-free survival difference was calculated between the two defined groups.
Figure 2
Figure 2
Disease-free survival analysis of colon cancer patients stratified into high and low groups according to the GPS expression or 15 cell cycle-regulated genes included in the GPS. In both cohorts, the low GPS groups had significantly shorter DFS compared with the high GPS groups (A and C). This difference was more significant when only cell cycle-regulated genes were used to stratify patients (D and F). The same association was found when the analysis was limited to those cohort A patients who received no adjuvant therapy (B and E).
Figure 3
Figure 3
Stratification effect of the GPS on two cohorts of breast cancer patients. The heat maps represent the normalised gene expression values of the GPS genes across samples. Each row represents one gene and each column represents one sample. Colour bars on the top of heat maps represent proliferation groups (high proliferation is indicated in red, and low proliferation is indicated in green as defined by K-means clustering) and recurrence status (black, recurrence; grey, nonrecurrence). There is a close correlation between high GPS expression and recurrence in both cohorts. Disease-free survival is significantly shorter in the high GPS groups compared with the low GPS groups.

References

    1. Allegra CJ, Paik S, Colangelo LH, Parr AL, Kirsch I, Kim G, Klein P, Johnston PG, Wolmark N, Wieand HS (2003) Prognostic value of thymidylate synthase, Ki-67, and p53 in patients with dukes' B and C colon cancer: a National Cancer Institute-national surgical adjuvant breast and bowel project collaborative study. J Clin Oncol 21: 241–250 - PubMed
    1. Barzanti F, Dal Susino M, Volpi A, Amadori D, Riccobon A, Scarpi E, Medri L, Bernardi L, Naldi S, Aldi M, Gaudio M, Zoli W (2000) Comparison between different cell kinetic variables in human breast cancer. Cell Prolif 33: 75–89 - PMC - PubMed
    1. Chen X, Cheung ST, So S, Fan ST, Barry C, Higgins J, Lai K-M, Ji J, Dudoit S, Ng IOL, van de Rijn M, Botstein D, Brown PO (2002) Gene expression patterns in human liver cancers. Mol Biol Cell 13: 1929–1939 - PMC - PubMed
    1. Chung CH, Parker JS, Karaca G, Wu J, Funkhouser WK, Moore D, Butterfoss D, Xiang D, Zanation A, Yin X (2004) Molecular classification of head and neck squamous cell carcinomas using patterns of gene expression. Cancer Cell 5: 489–500 - PubMed
    1. Colantuoni C, Henry G, Zeger S, Pevsner J (2002) SNOMAD (Standardization and NOrmalization of MicroArray Data): web-accessible gene expression data analysis. Bioinformatics 18: 1540–1541 - PubMed

Publication types

MeSH terms