

Sleep homeostasis during repeated sleep restriction and recovery: support from EEG dynamics
- PMID: 19238809
- PMCID: PMC2635586
- DOI: 10.1093/sleep/32.2.217
Sleep homeostasis during repeated sleep restriction and recovery: support from EEG dynamics
Abstract
Study objectives: Sleep reduction normally causes a homeostatic response during subsequent recovery sleep, but this does not seem to be true for repeated partial sleep loss. The aim of the present study was to test the response to repeated partial sleep loss through detailed focus on spectral data and parts of sleep.
Design: The experiment involved 4 h of sleep across 5 days in the laboratory (partial sleep deprivation [PSD]), followed by 3 days of recovery sleep. PSD was achieved through a delayed bedtime. Nine individuals participated. To avoid "laboratory monotony," subjects were permitted to leave the lab for a few hours each day.
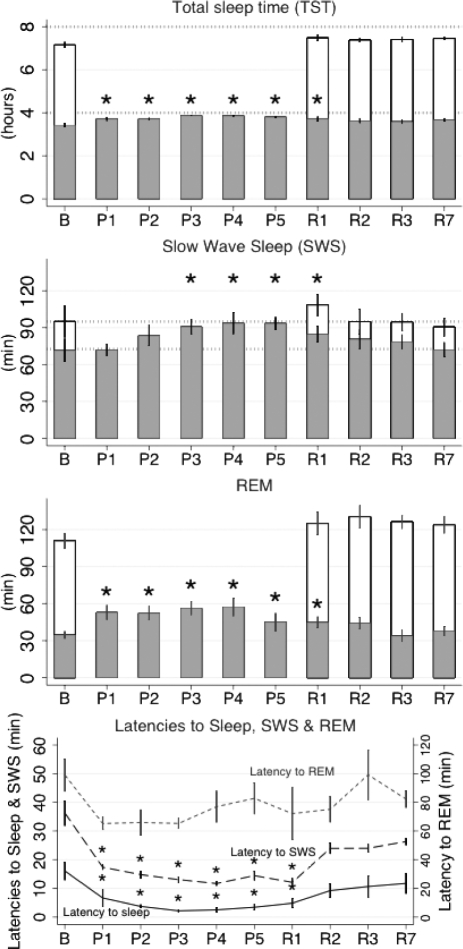
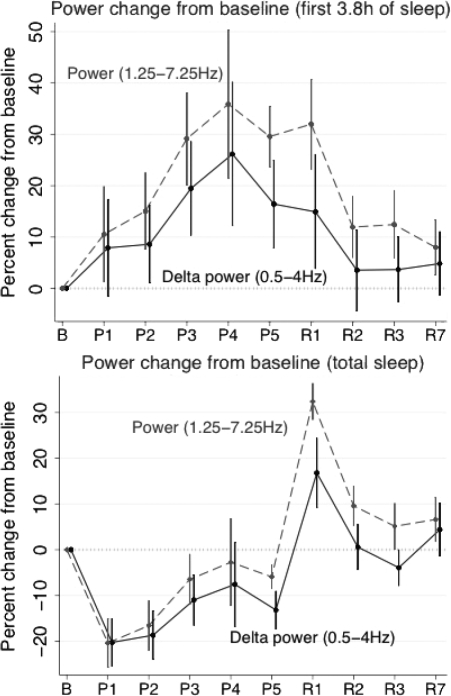
Measurements and results: All sleep stages and the latencies to sleep and slow wave sleep (SWS) showed a significant reduction during PSD. However, SWS and TST (total sleep time) during the first half of sleep increased gradually across days with PSD. During the first recovery sleep, SWS was significantly increased, while stage 1 and latency to stage 3 were reduced. All were back to baseline on the second night of recovery sleep. Summed spectral power during the first 3.8 h of sleep showed a gradual and robust increase (50% above baseline) in the range 1.25-7.25 Hz across days with PSD up to first recovery sleep and then returned to baseline.
Conclusions: SWS and summed power density in a broad low-frequency band respond to repeated partial sleep deprivation in a dose-response fashion during the first 4 h sleep, apparently reflecting a robust and stable homeostatic response to sleep loss.
Figures
References
-
- Webb WB, Agnew JHW. Stage 4 sleep: influence of time course variables. Science. 1971;174:1354–6. - PubMed
-
- Borbély AA, Baumann F, Brandeis D, Strauch I, Lehmann D. Sleep deprivation: effects on sleep stages and EEG power density in man. Electroencephalogr Clin Neurophysiol. 1981;51:483–93. - PubMed
-
- Webb WB, Agnew HW. Sleep: Effects of a restricted regime. Science. 1965;150:1745–7. - PubMed
-
- Carskadon MA, Dement WC. Cumulative effects of sleep restriction on daytime sleepiness. Psychophysiology. 1981;18:107–13. - PubMed
-
- Brunner P, Dijk D-J, Borbély AA. Repeated partial sleep deprivation progressively changes the EEG during sleep and wakefulness. Sleep. 1993;16:100–13. - PubMed
Publication types
MeSH terms
LinkOut - more resources
Full Text Sources
Miscellaneous
