. 2009 Apr;8(2):178-91.
doi: 10.1111/j.1474-9726.2009.00460.x. Epub 2009 Feb 23.

Molecular architecture of myelinated peripheral nerves is supported by calorie restriction with aging

Affiliations

Molecular architecture of myelinated peripheral nerves is supported by calorie restriction with aging

Sunitha Rangaraju et al. Aging Cell. 2009 Apr.

Abstract

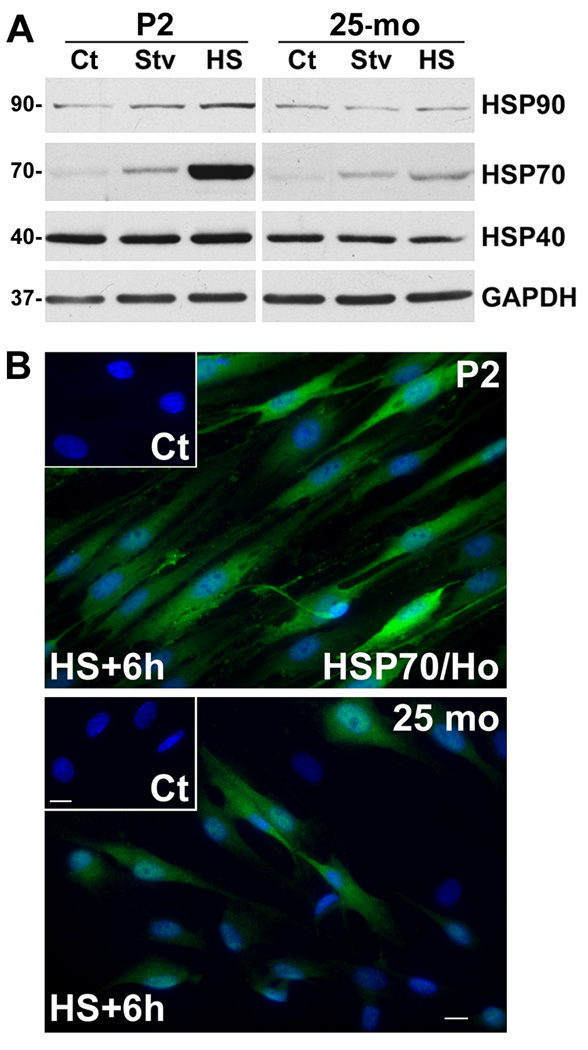
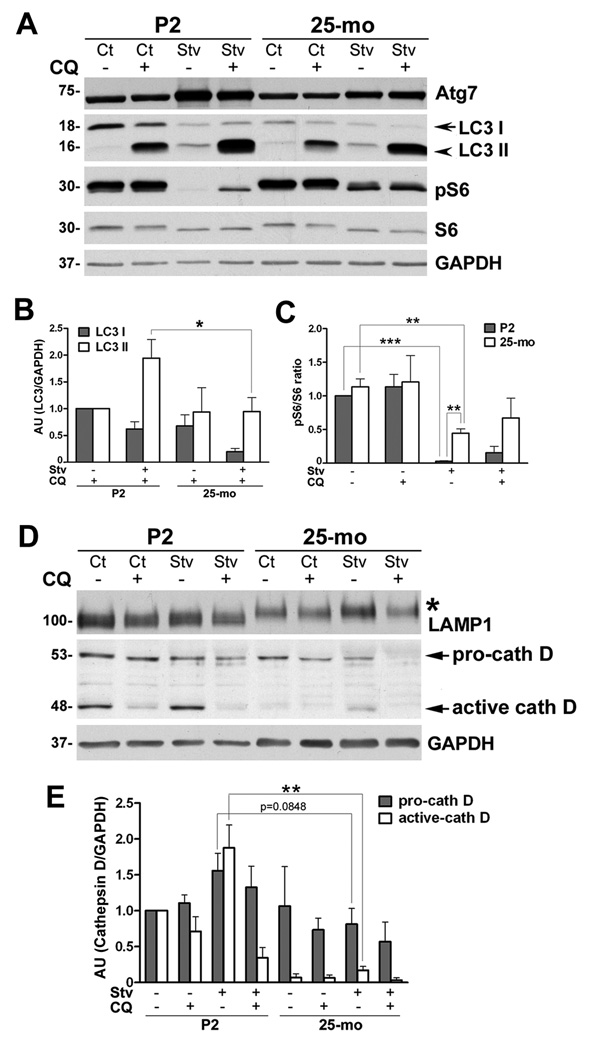
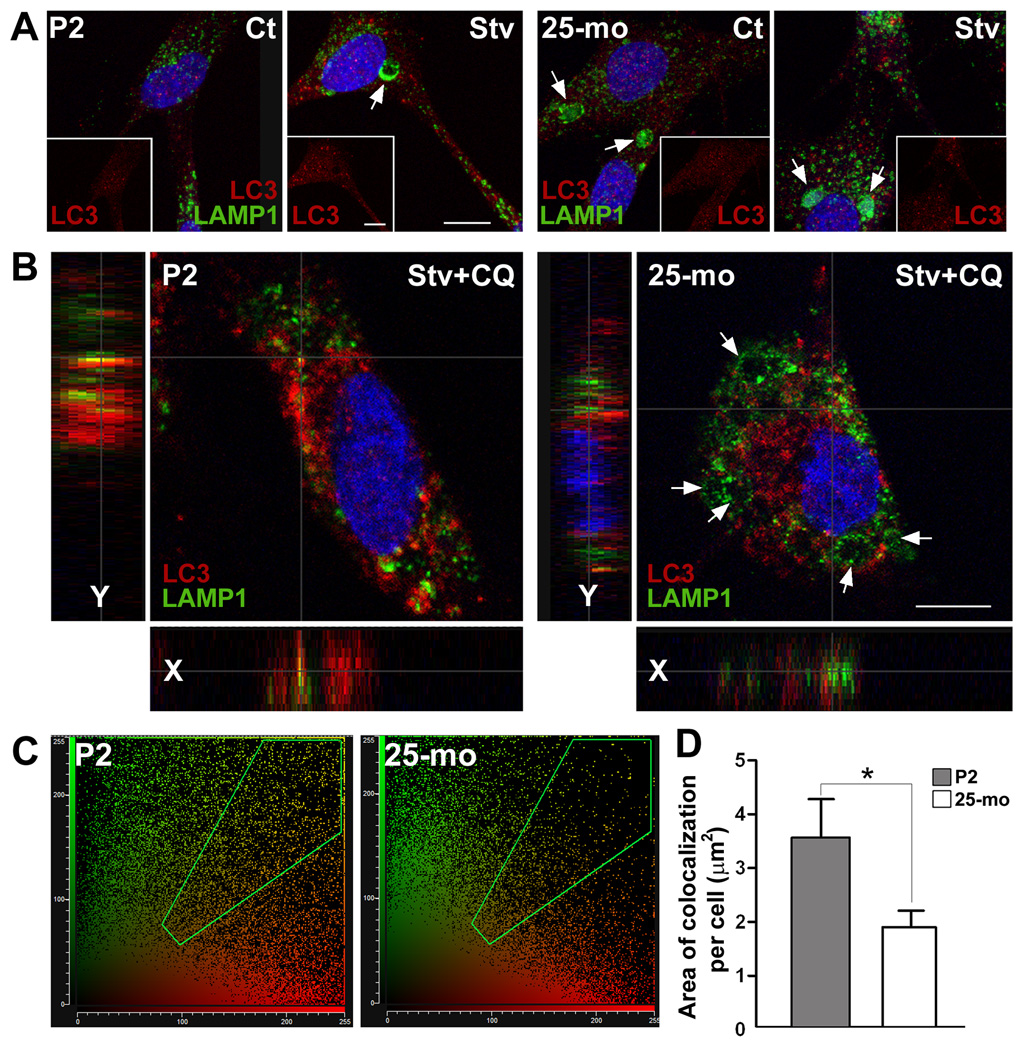
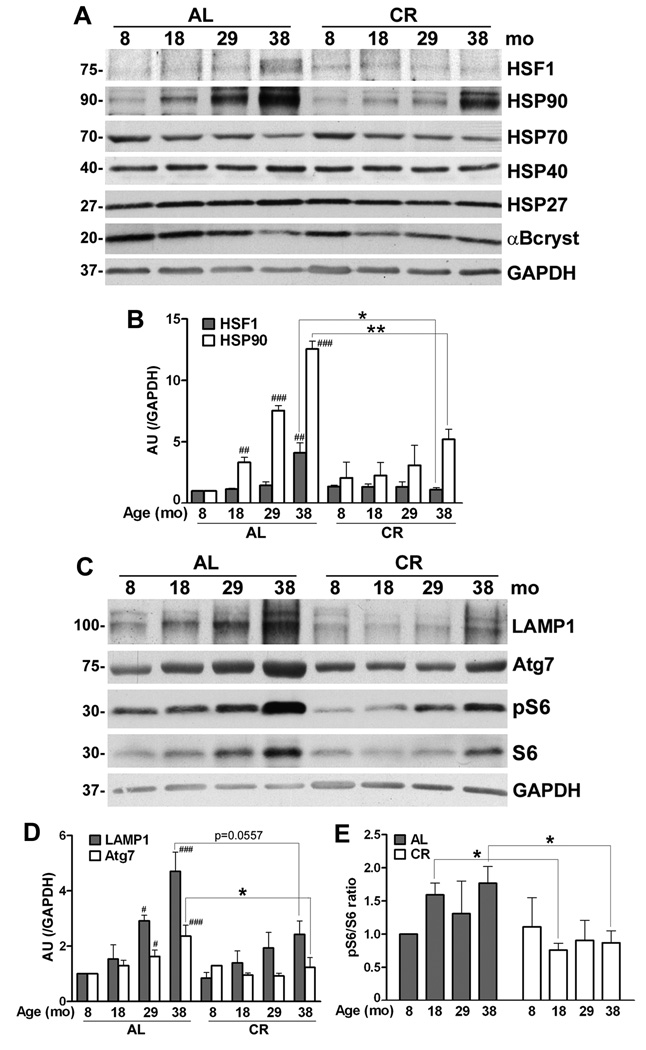
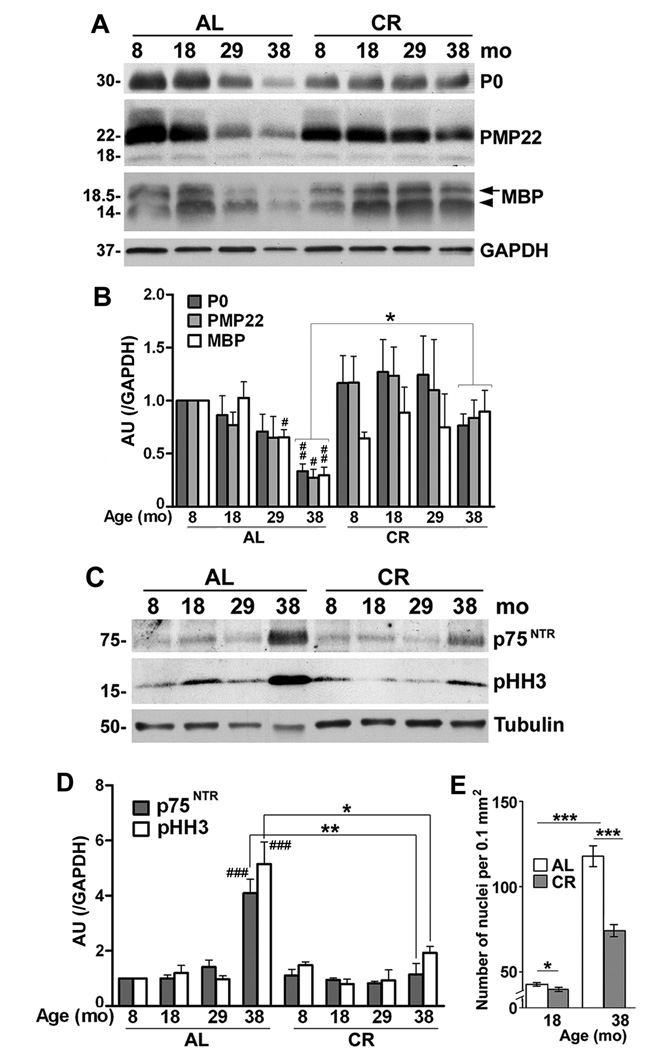
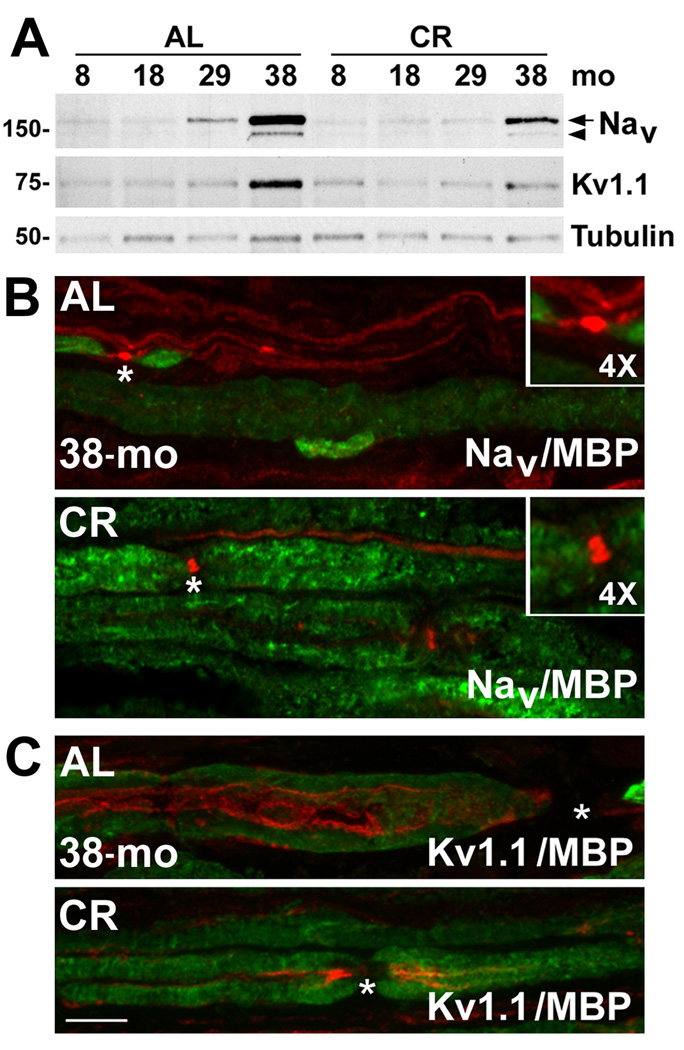
Peripheral nerves from aged animals exhibit features of degeneration, including marked fiber loss, morphological irregularities in myelinated axons and notable reduction in the expression of myelin proteins. To investigate how protein homeostatic mechanisms change with age within the peripheral nervous system, we isolated Schwann cells from the sciatic nerves of young and old rats. The responsiveness of cells from aged nerves to stress stimuli is weakened, which in part may account for the observed age-associated alterations in glial and axonal proteins in vivo. Although calorie restriction is known to slow the aging process in the central nervous system, its influence on peripheral nerves has not been investigated in detail. To determine if dietary restriction is beneficial for peripheral nerve health and glial function, we studied sciatic nerves from rats of four distinct ages (8, 18, 29 and 38 months) kept on an ad libitum (AL) or a 40% calorie restricted diet. Age-associated reduction in the expression of the major myelin proteins and widening of the nodes of Ranvier are attenuated by the dietary intervention, which is paralleled with the maintenance of a differentiated Schwann cell phenotype. The improvements in nerve architecture with diet restriction, in part, are underlined by sustained expression of protein chaperones and markers of the autophagy-lysosomal pathway. Together, the in vitro and in vivo results suggest that there might be an age-limit by which dietary intervention needs to be initiated to elicit a beneficial response on peripheral nerve health.


Figures

Figure 1
Figure 1. The chaperone response of Schwann cells from aged rats
(A) Schwann cells isolated from P2 and 25-mo rats were treated with amino acid and serum-deficient starvation (Stv) medium, or subjected to HS and allowed to recover at 37 °C for 6 h. Steady-state expression of HSP90, HSP70 and HSP40 were analyzed in whole cell lysates (15 µg/lane) of untreated control (Ct), Stv- or HS-treated samples. Blots were reprobed with anti-GAPDH antibody as a protein loading control. Molecular mass at the left, in kDa. (B) Schwann cells isolated from P2 and 25-mo old rats were subjected to HS (45 °C; 20 min) and allowed to recover at 37 °C for 6 h (HS+6h). Control untreated cells (Ct) and HS+6h samples were immunolabeled with anti-HSP70 (green) antibody. Hoechst dye (blue) was used to visualize nuclei. Scale bar, 10 µm.
Figure 2
Figure 2. The response of glial cells to Stv stimulus
(A) Primary rat Schwann cells from postnatal day 2 (P2) and 25-mo old rats were maintained in normal (Control, Ct), or amino acid and serum-deficient Stv medium for 4 h, with (+) or without (−) chloroquine (CQ). The levels of autophagy markers, Atg7, LC3 I and II, pS6 and S6 were determined by Western blots (15 µg/lane). (B) Quantification of LC3 I and LC3 II band intensities in the presence of CQ normalized to GAPDH from three independent experiments are shown. LC3 I and II values of P2 cells treated with CQ was set as 1. AU:arbitrary units. (*p<0.05, unpaired t-test, mean ± SEM, n=3). (C) Levels of pS6 and S6 from three independent experiments were quantified and the values are represented as ratio of pS6/S6. The value of P2 Ct sample was set as 1. (D) The expression of lysosome-associated membrane protein 1 (LAMP1) and cathepsin D were determined by Western blots. The shift in LAMP1 mobility in 25-mo samples is indicated by an asterisk. The bands representing pro-cathepsin D (pro-cath D) and active form of cathepsin D (active cath D) are marked with arrows. (E) Semi-quantitative analysis of pro-cath D and active-cath D protein levels after normalization to GAPDH from three independent experiments. The values of pro- and active-cath D in P2 Ct sample were set as 1. AU:arbitrary units. (**p<0.01, ***p<0.001, unpaired t-test, mean ± SEM). (A and D) GAPDH is shown as a protein loading control. Molecular mass at left, in kDa.
Figure 3
Figure 3. The fusion of autophagosomes with lysosomes in Schwann cells
(A) Composite confocal images of control (Ct) and Stv-treated (Stv) Schwann cells from postnatal day 2 (P2) and 25-mo old rats, double immunostained with anti-LC3 (red) and anti-LAMP1 (green) antibodies. Insets show LC3-like (red) staining alone. Enlarged lysosomes positive for LAMP1 (green) are indicated by arrows. (B) Mid z-stack images of cells after treatment with chloroquine (CQ), in Stv medium. Single x and y plane sections are shown at the left to reveal the interaction of autophagosomes (red) with lysosomes (green), in yellow. In cells from 25-mo old rats, swollen LAMP1-positive lysosomes (green) are indicated by arrows. Nuclei are visualized by Hoechst dye (blue). Scale bars, 10 µm. (C) 2D cytofluorograms for LC3 and LAMP1 colocalization in Stv+CQ treated P2 and 25-mo samples in which the interaction between the red channel (x-axis) and the green channel (y-axis) is highlighted in green in the diagonal region. (D) The area of colocalization (mask area) per cell was estimated using Leica software from P2 and 25-mo cells (n=200) treated with Stv+CQ from three independent experiments, and eight random visual fields per condition (*p<0.05, unpaired t-test, mean ± SEM).
Figure 4
Figure 4. Age-associated alterations in chaperones and autophagic proteins in myelinated peripheral nerves
(A) Total sciatic nerve lysates (25 µg/lane) from the indicated ages and diet were analyzed with anti-heat shock factor 1 (HSF1) antibody. The same nerve lysates (20 µg/lane) were also probed with antibodies against HSP90, HSP70, HSP40, HSP27 and αB-crystallin. (B) Quantification of HSF1 and HSP90 protein levels normalized to GAPDH from three independent experiments (##p<0.01, ###p<0.001, Fisher’s PLSD, mean ± SEM), AU: arbitrary units. The effect of CR on these proteins was analyzed by comparing HSF1 or HSP90 protein values with age-matched AL counterparts (*p<0.05, **p<0.05, unpaired t-test, mean ± SEM). (C) Steady-state levels of LAMP1, Atg7, pS6 and S6 proteins in sciatic nerves from AL and CR rats were analyzed by Western blots. Blots were reprobed with anti-GAPDH antibody as protein loading control. Molecular mass at the left, in kDa. (D) Quantification of LAMP1 and Atg7 protein levels normalized to GAPDH from three independent experiments (#p<0.05, ###p<0.001, Fisher’s PLSD analysis, *p<0.05, unpaired t-test, mean ± SEM). (E) Blots of pS6 and S6 from three independent experiments were quantified and the values are represented as ratio of pS6/S6. The pS6/S6 ratio of 8-mo old AL sample was set as 1 (*p<0.05, unpaired t-test, mean ± SEM). A-D, n=3 rats per condition.
Figure 5
Figure 5. CR preserves myelin protein expression and myelinating Schwann cell phenotype
(A) Total sciatic nerve lysates (10 µg/lane) from AL and CR rats at 8, 18, 29 and 38-mo ages were analyzed with antibodies against protein zero (P0), peripheral myelin protein 22 (PMP22) and myelin basic protein (MBP) by Western blots. The arrow and arrowhead on the right indicate the 18.5 and 14 kDa of isoforms of MBP. GAPDH serves as a protein loading control. (B) Densitometric analysis of myelin proteins P0, PMP22 and MBP normalized to GAPDH (#p<0.05, ##p<0.01 [Fisher’s PLSD], *p<0.05 [unpaired t-test], mean ± SEM). (C) Total sciatic nerve lysates (20 µg/lane) from rats under AL and CR diet were analyzed by Western blotting with polyclonal anti-p75NTR and monoclonal anti-pHH3 antibodies. The blots were reprobed with anti-tubulin to monitor protein loading. Molecular mass at left, in kDa. (D) Quantification of p75NTR and pHH3 normalized to GAPDH (###p<0.001 [Fisher’s PLSD], *p<0.05, *p<0.01, ***p<0.001 [unpaired t-test]). (E) The nuclei of Schwann cells were counted in longitudinal sections of sciatic nerves from two different depths and eight random visual fields (0.1mm2) per animal. (*p<0.05, ***p<0.001, unpaired t-test, mean ± SEM). A-E, n=3 rats per condition.
Figure 6
Figure 6. The expression of axonal proteins is supported by CR diet
(A) The severe reduction in MBP-like (red) as well as NF-L-like (green) staining is shown on longitudinal sections of sciatic nerves of 38-mo old AL-fed rats. Arrowheads indicate nerve fibers positive for neurofilaments but devoid of MBP-reactive myelin. Nerves from 18-mo old AL and CR rats are shown in the insets on the right. Nuclei are stained with Hoechst dye (blue). Scale bars, 40 µm. (B) Total sciatic nerve lysates (10 µg/lane) of AL and CR rats from the indicated ages were analyzed with antibodies against neurofilament proteins, NF-H, NF-M, NF-L and the intermediate filament protein, vimentin. The arrow indicates the full-length form (60 kDa) and the bracket shows the proteolytic cleavage products of vimentin. Tubulin serves as a protein loading control. Molecular mass at left, in kDa. (C) Densitometric analysis of neurofilament proteins NF-H, -M and -L normalized to tubulin from three independent sets of blots (#p<0.05, ##p<0.01 (Fisher’s PLSD), *p<0.05 (unpaired t-test), mean ± SEM, n=3 rats). AU:arbitrary units.
Figure 7
Figure 7. The expression and localization of Na+ and K+ channel proteins in myelinated nerves of aged rats
(A) Lysates of sciatic nerves (25 µg/lane) from the indicated ages and diet regimen (AL and CR) were assayed by Western blots for the expression of pan-voltage gated sodium channels (Nav) and a subtype of voltage gated potassium channel (Kv1.1) with polyclonal anti-pan Nav and anti-Kv1.1 antibodies, respectively. The arrow indicates the full length α-subunit of Nav and the arrowhead points to its proteolytic cleavage product. Tubulin serves as a protein loading control. Molecular mass at left, in kDa. (B) Longitudinal sciatic nerve sections were co-immunolabeled with anti-pan Nav (red) and anti-MBP (green) antibodies (panel on right). The node of Ranvier, as marked by clustered Nav channel-like staining (asterisk) is enlarged 4× in the inset. (C) Localization of Kv1.1 channel was visualized in longitudinal sciatic nerve sections from 38-mo old AL and CR rats by co-immunolabeling with anti-Kv1.1 (red) and anti-MBP (green) antibodies (panel on right). The nodes of Ranvier are marked by asterisks. Scale bar, 10 µm.

References

    1. Adinolfi AM, Yamuy J, Morales FR, Chase MH. Segmental demyelination in peripheral nerves of old cats. Neurobiol Aging. 1991;12:175–179. - PubMed
    1. Amici SA, Dunn WA, Jr, Notterpek L. Developmental abnormalities in the nerves of peripheral myelin protein 22-deficient mice. J Neurosci Res. 2007;85:238–249. - PubMed
    1. Aquino DA, Lopez C, Farooq M. Antisense oligonucleotide to the 70-kDa heat shock cognate protein inhibits synthesis of myelin basic protein. Neurochem Res. 1996;21:417–422. - PubMed
    1. Benz I, Beck W, Kraas W, Stoll D, Jung G, Kohlhardt M. Two types of modified cardiac Na+ channels after cytosolic interventions at the alpha-subunit capable of removing Na+ inactivation. Eur Biophys J. 1997;25:189–200. - PubMed
    1. Bergamini E, Cavallini G, Donati A, Gori Z. The anti-ageing effects of caloric restriction may involve stimulation of macroautophagy and lysosomal degradation, and can be intensified pharmacologically. Biomed Pharmacother. 2003;57:203–208. - PubMed

Publication types

MeSH terms