

Cytolethal distending toxin-induced cell cycle arrest of lymphocytes is dependent upon recognition and binding to cholesterol
- PMID: 19240023
- PMCID: PMC2667752
- DOI: 10.1074/jbc.M809094200
Cytolethal distending toxin-induced cell cycle arrest of lymphocytes is dependent upon recognition and binding to cholesterol
Abstract
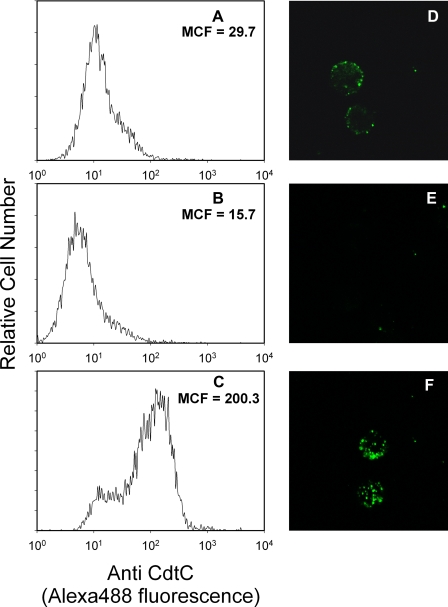
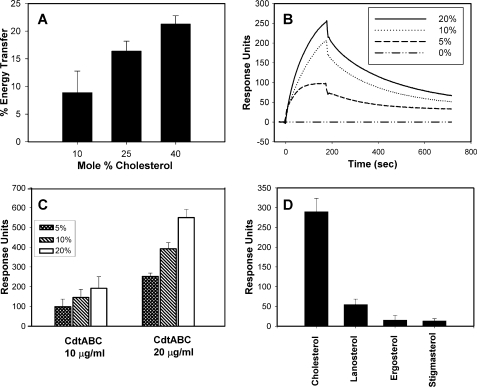
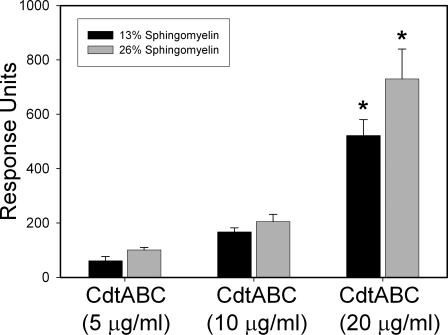
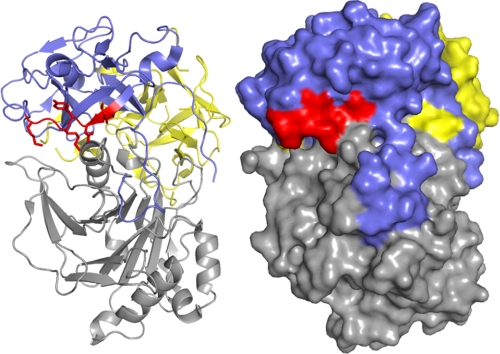
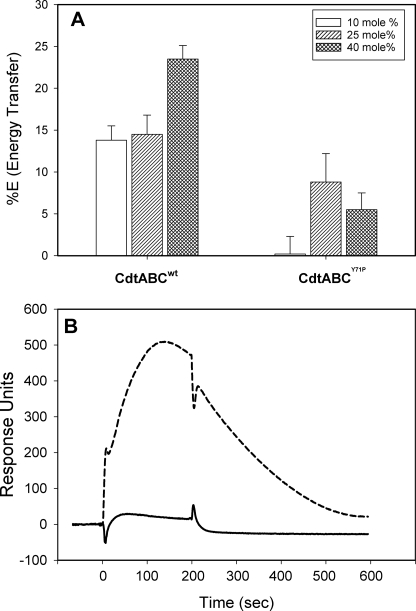
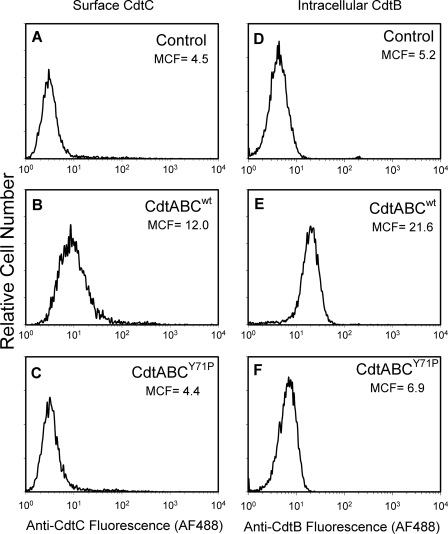
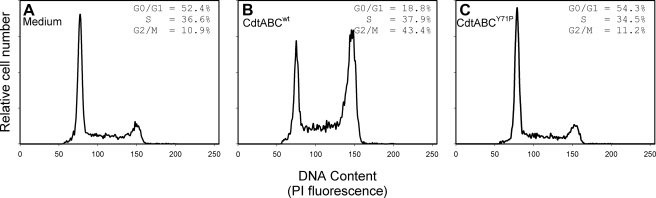
Induction of cell cycle arrest in lymphocytes after exposure to the Aggregatibacter actinomycetemcomitans cytolethal distending toxin (Cdt) is dependent upon the integrity of lipid membrane microdomains. In this study we further demonstrate that the association of Cdt with lymphocyte plasma membranes is dependent upon binding to cholesterol. Depletion of cholesterol resulted in reduced toxin binding, whereas repletion of cholesterol-depleted cells restored binding. We employed fluorescence resonance energy transfer and surface plasmon resonance to demonstrate that toxin association with model membranes is dependent upon the concentration of cholesterol; moreover, these interactions were cholesterol-specific as the toxin failed to interact with model membranes containing stigmasterol, ergosterol, or lanosterol. Further analysis of the toxin indicated that the CdtC subunit contains a cholesterol recognition/interaction amino acid consensus (CRAC) region. Mutation of the CRAC site resulted in decreased binding of the holotoxin to cholesterol-containing model membranes as well as to the surface of Jurkat cells. The mutant toxin also exhibited reduced capacity for intracellular transfer of the active toxin subunit, CdtB, as well as reduced toxicity. Collectively, these observations indicate that membrane cholesterol serves as an essential ligand for Cdt and that this association can be blocked by either depleting membranes of cholesterol or mutation of the CRAC site.
Figures
Similar articles
-
Molecular Mechanisms and Potential Clinical Applications of Campylobacter jejuni Cytolethal Distending Toxin.Front Cell Infect Microbiol. 2016 Feb 9;6:9. doi: 10.3389/fcimb.2016.00009. eCollection 2016. Front Cell Infect Microbiol. 2016. PMID: 26904508 Free PMC article. Review.
-
The Aggregatibacter actinomycetemcomitans Cytolethal Distending Toxin Active Subunit CdtB Contains a Cholesterol Recognition Sequence Required for Toxin Binding and Subunit Internalization.Infect Immun. 2015 Oct;83(10):4042-55. doi: 10.1128/IAI.00788-15. Epub 2015 Jul 27. Infect Immun. 2015. PMID: 26216427 Free PMC article.
-
Internalization of the Active Subunit of the Aggregatibacter actinomycetemcomitans Cytolethal Distending Toxin Is Dependent upon Cellugyrin (Synaptogyrin 2), a Host Cell Non-Neuronal Paralog of the Synaptic Vesicle Protein, Synaptogyrin 1.Front Cell Infect Microbiol. 2017 Nov 14;7:469. doi: 10.3389/fcimb.2017.00469. eCollection 2017. Front Cell Infect Microbiol. 2017. PMID: 29184850 Free PMC article.
-
Characterization of putative cholesterol recognition/interaction amino acid consensus-like motif of Campylobacter jejuni cytolethal distending toxin C.PLoS One. 2013 Jun 6;8(6):e66202. doi: 10.1371/journal.pone.0066202. Print 2013. PLoS One. 2013. PMID: 23762481 Free PMC article.
-
A Journey of Cytolethal Distending Toxins through Cell Membranes.Front Cell Infect Microbiol. 2016 Aug 10;6:81. doi: 10.3389/fcimb.2016.00081. eCollection 2016. Front Cell Infect Microbiol. 2016. PMID: 27559534 Free PMC article. Review.
Cited by
-
Cytolethal distending toxin-induced release of interleukin-1β by human macrophages is dependent upon activation of glycogen synthase kinase 3β, spleen tyrosine kinase (Syk) and the noncanonical inflammasome.Cell Microbiol. 2020 Jul;22(7):e13194. doi: 10.1111/cmi.13194. Epub 2020 Mar 4. Cell Microbiol. 2020. PMID: 32068949 Free PMC article.
-
Molecular Mechanisms and Potential Clinical Applications of Campylobacter jejuni Cytolethal Distending Toxin.Front Cell Infect Microbiol. 2016 Feb 9;6:9. doi: 10.3389/fcimb.2016.00009. eCollection 2016. Front Cell Infect Microbiol. 2016. PMID: 26904508 Free PMC article. Review.
-
Breaking the Gingival Epithelial Barrier: Role of the Aggregatibacter actinomycetemcomitans Cytolethal Distending Toxin in Oral Infectious Disease.Cells. 2014 May 23;3(2):476-99. doi: 10.3390/cells3020476. Cells. 2014. PMID: 24861975 Free PMC article.
-
Cellugyrin (synaptogyrin-2) dependent pathways are used by bacterial cytolethal distending toxin and SARS-CoV-2 virus to gain cell entry.Front Cell Infect Microbiol. 2024 Apr 18;14:1334224. doi: 10.3389/fcimb.2024.1334224. eCollection 2024. Front Cell Infect Microbiol. 2024. PMID: 38698905 Free PMC article.
-
The cytolethal distending toxin effects on Mammalian cells: a DNA damage perspective.Cells. 2014 Jun 11;3(2):592-615. doi: 10.3390/cells3020592. Cells. 2014. PMID: 24921185 Free PMC article.
References
-
- Okuda, J., Kurazono, H., and Takeda, Y. (1995) Microb. Pathog. 18 167-172 - PubMed
Publication types
MeSH terms
Substances
Grants and funding
LinkOut - more resources
Full Text Sources
Medical
