. 2009 Mar;8(3):615-25.
doi: 10.1158/1535-7163.MCT-08-1196. Epub 2009 Feb 24.

Regulation of leukemic cell differentiation and retinoid-induced gene expression by statins

Affiliations

Regulation of leukemic cell differentiation and retinoid-induced gene expression by statins

Antonella Sassano et al. Mol Cancer Ther. 2009 Mar.

Abstract

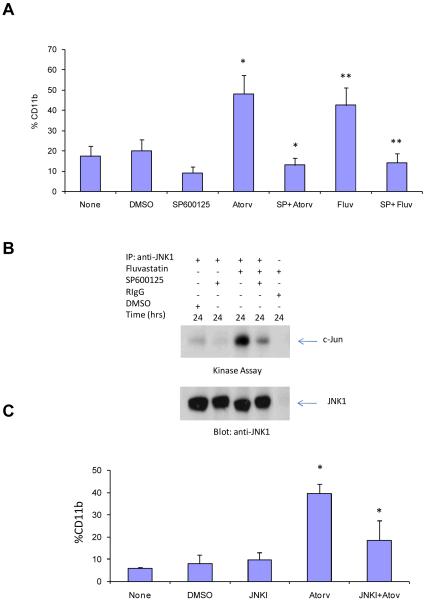
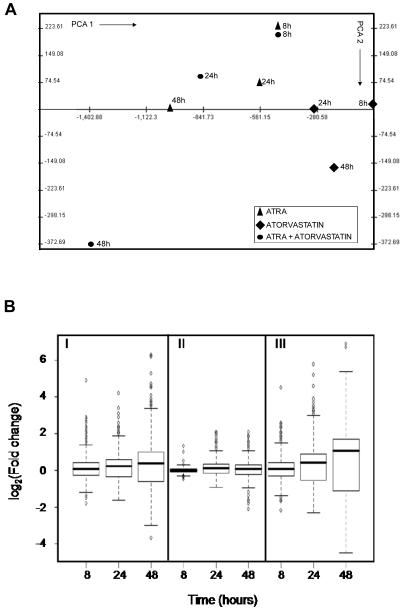
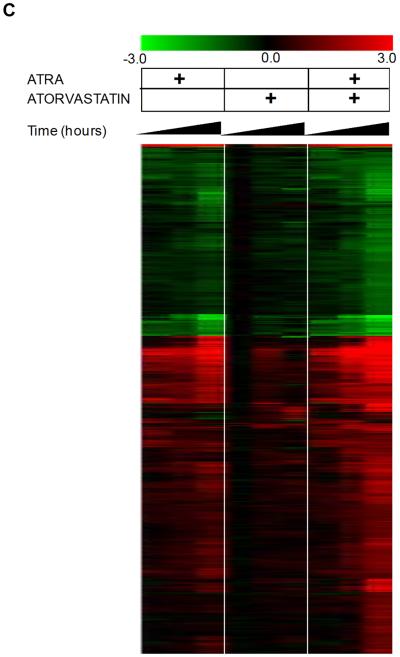
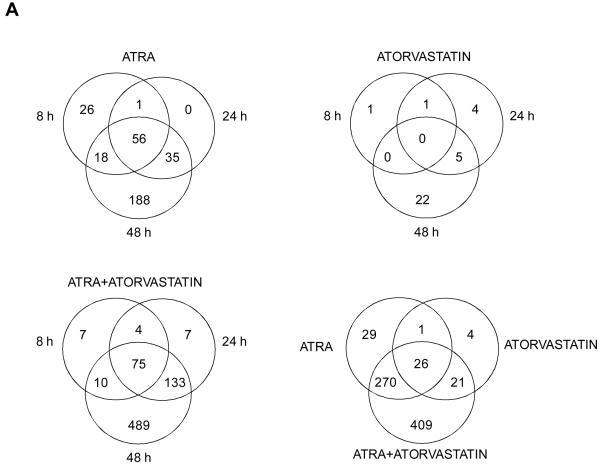
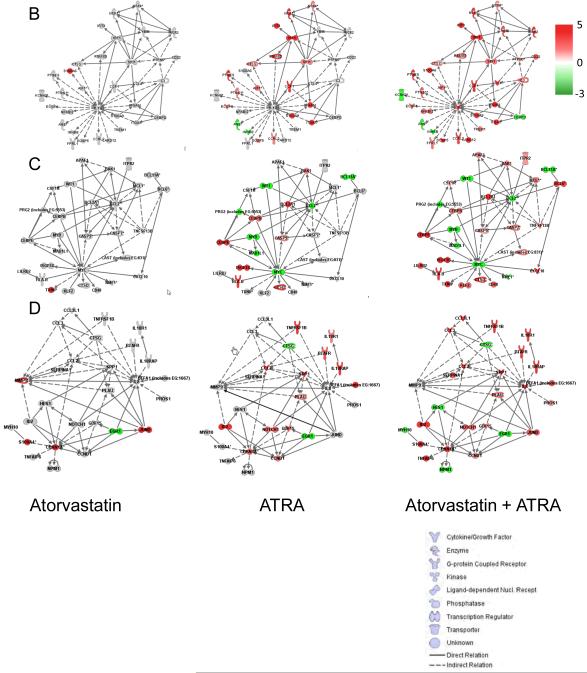
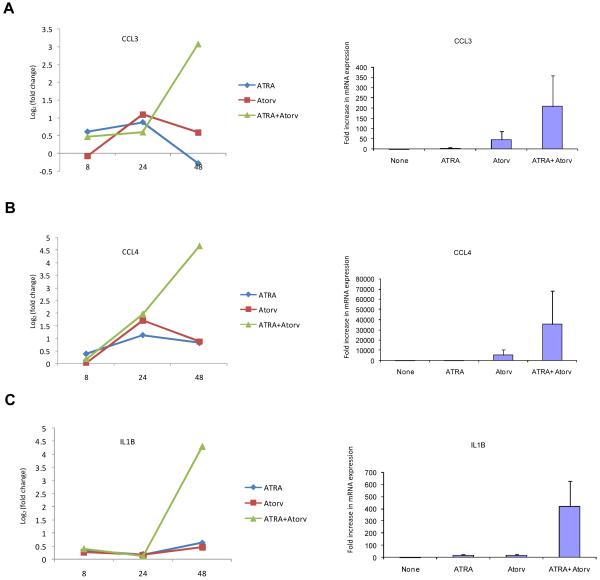
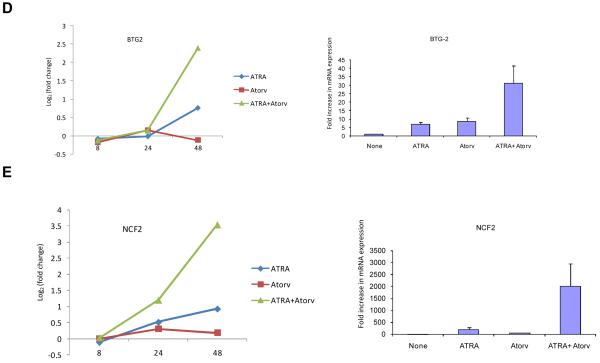
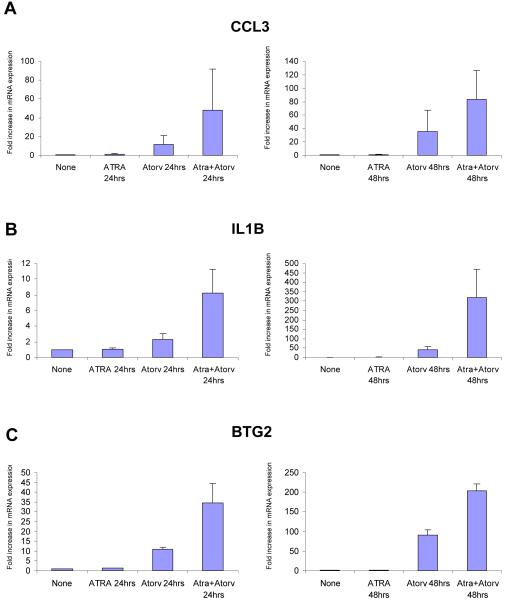
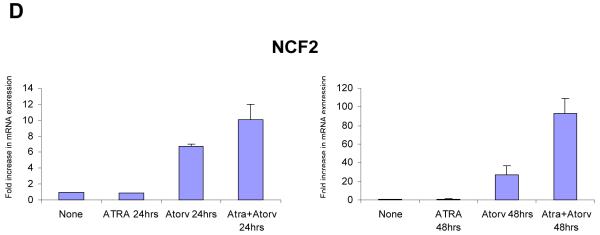
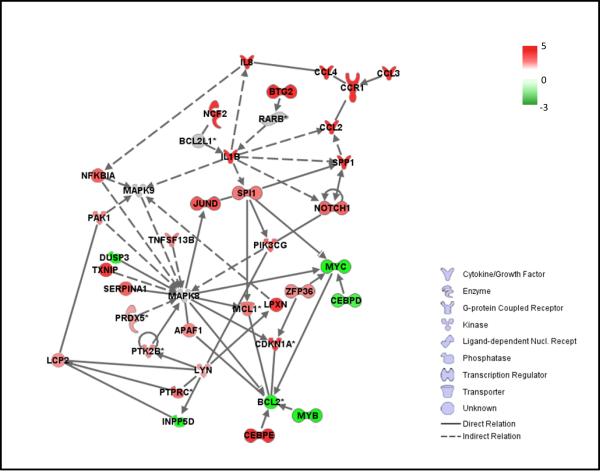
There is emerging evidence that, beyond their cholesterol-lowering properties, statins exhibit important antileukemic effects in vitro and in vivo, but the precise mechanisms by which they generate such responses remain to be determined. We have previously shown that statins promote differentiation of acute promyelocytic leukemia cells and enhance generation of all-trans retinoic acid (ATRA)-dependent antileukemic responses. We now provide evidence that statin-dependent leukemic cell differentiation requires engagement and activation of the c-Jun NH2-terminal kinase kinase pathway. In addition, in experiments, to define the molecular targets and mediators of statin-induced differentiation, we found a remarkable effect of statins on ATRA-dependent gene transcription, evidenced by the selective induction of over 400 genes by the combination of atorvastatin and ATRA. Altogether, our studies identify novel statin molecular targets linked to differentiation, establish that statins modulate ATRA-dependent transcription, and suggest that combined use of statins with retinoids may provide a novel approach to enhance antileukemic responses in acute promyelocytic leukemia and possibly other leukemias.


Figures

Figure 1
Figure 1
Requirement of JNK for atorvastatin- or fluvastatin-induced differentiation of APL cells. A. NB4 cells were pre-incubated for 60 min in the absence or presence of SP600125 (20μM) and treated for 48 hrs in absence or presence of DMSO (control) or atorvastatin (2μM). The cells were subsequently stained with a phycoerythrin (PE)-conjugated anti-CD11b monoclonal antibody and analyzed by flow cytometry. The data represent means + S.E. of 4 independent experiments. Paired two-tailed t test analysis showed a two-tailed p=0.015 for atorvastatin alone versus the combination of SP600125 + atorvastatin and two-tailed p=0.03 for fluvastatin alone versus the combination of SP600125 + fluvastatin. B. (Upper panel) NB4 cells were pre-incubated for 60 min in the absence or presence of the JNK inhibitor SP600125 (20μM), and then treated with or without fluvastatin (10μM), or exposed to DMSO as solvent control for the indicated time. Cell lysates were immunoprecipitated (IP) with an antibody against JNK1 or control non-immune rabbit immunoglobulin (RIgG). The immunoprecipitates were then subjected to in vitro kinase assays, using c-Jun as an exogenous substrate. Proteins were analyzed by SDS-PAGE, and the phosphorylated form of c-Jun was detected by autoradiography. (Lower panel) The same blot was subsequently immunoblotted with an anti JNK1 antibody. C. NB4 cells were pre-incubated for 60 min in the absence or presence of JNKI peptide (5 μM) and treated for 48 hrs in absence or presence of DMSO (control) or atorvastatin (2μM). The cells were subsequently stained with a phycoerythrin (PE)-conjugated anti-CD11b monoclonal antibody and analyzed by flow cytometry. The data represent means + S.E. of three experiments. Paired two-tailed t test analysis showed a two-tailed p=0.0464 for atorvastatin versus JNKI + atorvastatin
Figure 2
Figure 2
Patterns of gene expression induced by atorvastatin or ATRA alone, or by the combination of ATRA + atorvastatin. A. Principal component analysis of treatments (PCA). PCA was performed using the average of the expression of the three replication for time point for the three prototypic situations. B. Distribution of fold changes existing between treatments versus untreated cells at the various time points in the set of 782 RefSeqs identified as significantly expressed differentially. I, ATRA; II, Atorvastatin; III, ATRA + Atorvastatin. C. Hierarchical clustering of 782 RefSeqs found differentially expressed by double step regression analysis.
Figure 2
Figure 2
Patterns of gene expression induced by atorvastatin or ATRA alone, or by the combination of ATRA + atorvastatin. A. Principal component analysis of treatments (PCA). PCA was performed using the average of the expression of the three replication for time point for the three prototypic situations. B. Distribution of fold changes existing between treatments versus untreated cells at the various time points in the set of 782 RefSeqs identified as significantly expressed differentially. I, ATRA; II, Atorvastatin; III, ATRA + Atorvastatin. C. Hierarchical clustering of 782 RefSeqs found differentially expressed by double step regression analysis.
Figure 3
Figure 3
Induction of gene expression by ATRA and/or atrovastatin in NB4 cells. A. Venn diagrams of differentially expressed RefSeqs characterized by an absolute log2 (fold change) of at least 1. Overlaps of the genes expressed at different time points for ATRA alone (left upper panel); Atrovastatin alone (right upper panel); and ATRA + Atorvastatin (left lower panel) are shown. Differentially expressed RefSeqs characterized by an absolute log2 (fold change) of at least 1 in at least one of the different time points of treatment is also shown (right lower panel). B-D. Relation found within differentially expressed genes, in at least one of the treatments and present in the enriched functional classes. Cluster 1, centered on IL1B gene at time point 48h (B), cluster 2, centered on MYC gene at time point 48h (C), cluster 3, centered on EGR1 gene at time point 48h (D).
Figure 3
Figure 3
Induction of gene expression by ATRA and/or atrovastatin in NB4 cells. A. Venn diagrams of differentially expressed RefSeqs characterized by an absolute log2 (fold change) of at least 1. Overlaps of the genes expressed at different time points for ATRA alone (left upper panel); Atrovastatin alone (right upper panel); and ATRA + Atorvastatin (left lower panel) are shown. Differentially expressed RefSeqs characterized by an absolute log2 (fold change) of at least 1 in at least one of the different time points of treatment is also shown (right lower panel). B-D. Relation found within differentially expressed genes, in at least one of the treatments and present in the enriched functional classes. Cluster 1, centered on IL1B gene at time point 48h (B), cluster 2, centered on MYC gene at time point 48h (C), cluster 3, centered on EGR1 gene at time point 48h (D).
Figure 4
Figure 4
Synergistic effect of ATRA and atorvastatin on gene expression. NB4 cells were treated for 8, 24 and 48 hrs with ATRA (0.5μM), atorvastatin (2μM), or the combination of ATRA and atorvastatin, as indicated. Patterns of gene expression for CCL3 (A, left panel), CCL4 (B, left panel), IL1B (C, left panel), BTG2 (D, left panel), and NCF2 (E, left panel) were investigated using Illumina Sentrix Human-6 Expression BeadChips. Three independent microarray experiments were performed and 2 steps regression strategy was applied as statistical analysis. Expression of mRNA for CCL3 (A, right panel), CCL4 (B, right panel), IL1B (C, right panel), BTG2 (D, right panel), and NCF2 (E, right panel) were evaluated by quantitative real time RT-PCR (TaqMan). GAPDH was used for normalization. Data are expressed as fold increase over untreated samples and represent means ± S.E. of 3 independent experiments.
Figure 4
Figure 4
Synergistic effect of ATRA and atorvastatin on gene expression. NB4 cells were treated for 8, 24 and 48 hrs with ATRA (0.5μM), atorvastatin (2μM), or the combination of ATRA and atorvastatin, as indicated. Patterns of gene expression for CCL3 (A, left panel), CCL4 (B, left panel), IL1B (C, left panel), BTG2 (D, left panel), and NCF2 (E, left panel) were investigated using Illumina Sentrix Human-6 Expression BeadChips. Three independent microarray experiments were performed and 2 steps regression strategy was applied as statistical analysis. Expression of mRNA for CCL3 (A, right panel), CCL4 (B, right panel), IL1B (C, right panel), BTG2 (D, right panel), and NCF2 (E, right panel) were evaluated by quantitative real time RT-PCR (TaqMan). GAPDH was used for normalization. Data are expressed as fold increase over untreated samples and represent means ± S.E. of 3 independent experiments.
Figure 5
Figure 5
Expression of genes associated with differentiation in ATRA resistant APL cells. NB4.306 cells were treated for 24 hrs (left panels) or 48 hrs (right panels) with ATRA (0.5μM), atorvastatin (2μM), or the combination of ATRA and atorvastatin, as indicated. Expression of mRNAs for CCL3 (A), IL1B (B), BTG2 (C) or NCF2 (D) was evaluated by quantitative real time RT-PCR (TaqMan), using GAPDH for normalization. Data are expressed as fold increase over untreated samples and represent means ± S.E. of 2-independent experiments.
Figure 5
Figure 5
Expression of genes associated with differentiation in ATRA resistant APL cells. NB4.306 cells were treated for 24 hrs (left panels) or 48 hrs (right panels) with ATRA (0.5μM), atorvastatin (2μM), or the combination of ATRA and atorvastatin, as indicated. Expression of mRNAs for CCL3 (A), IL1B (B), BTG2 (C) or NCF2 (D) was evaluated by quantitative real time RT-PCR (TaqMan), using GAPDH for normalization. Data are expressed as fold increase over untreated samples and represent means ± S.E. of 2-independent experiments.
Figure 6
Figure 6
Key connection links of the JNK kinase pathway to statin-induced genes associated with differentiation. IPA 7.0 analysis was performed as described in materials and methods. Functional relations were derived by connecting JNK to various genes selectively regulated after 48 hours treatment with the combination of atorvastatin and ATRA

Similar articles

Cited by

References

    1. Goldstein JL, Brown MS. Regulation of the mevalonate pathway. Nature. 1990;343:425–30. - PubMed
    1. Istvan ES, Deisenhofer J. Structural mechanism for statin inhibition of HMG-CoA reductase. Science. 2001;292:1160–64. - PubMed
    1. Ness GC, Zhao Z, Lopez D. Inhibitors of cholesterol biosynthesis increase hepatic low-density lipoprotein receptor protein degradation. Arch Biochem Biophys. 1996;325:242–48. - PubMed
    1. Sacks FM, Pfeffer MA, Moye LA, et al. Cholesterol and recurrent Events Trial investigators. The effect of pravastatin on coronary events after myocardial infarction in patients with average cholesterol levels. N Engl J Med. 1996;335:1001–9. - PubMed
    1. The long-term intervention with pravastatin in ischaemic disease (LIPID) study group Prevention of cardiovascular events and death with pravastatin in patients with coronary heart disease and a broad range of initial cholesterol levels. N Engl J Med. 1998;339:1349–57. No Authors Listed. - PubMed

Publication types

MeSH terms