

Cell-cycle-phase progression analysis identifies unique phenotypes of major prognostic and predictive significance in breast cancer
- PMID: 19240714
- PMCID: PMC2661794
- DOI: 10.1038/sj.bjc.6604924
Cell-cycle-phase progression analysis identifies unique phenotypes of major prognostic and predictive significance in breast cancer
Abstract
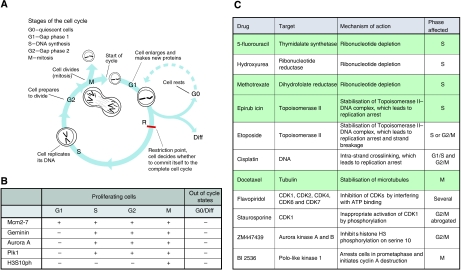
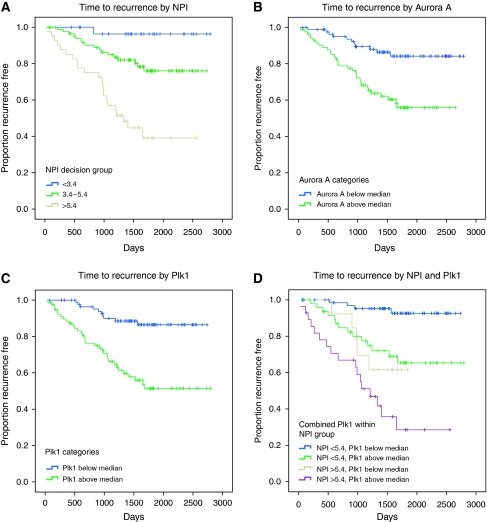
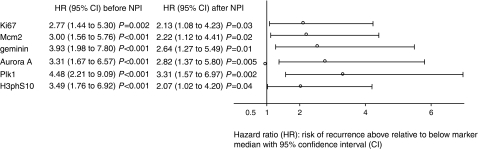
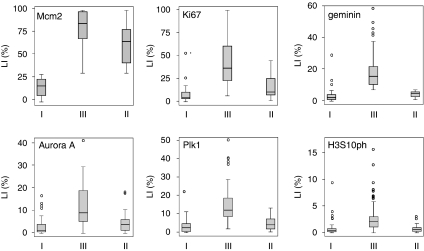
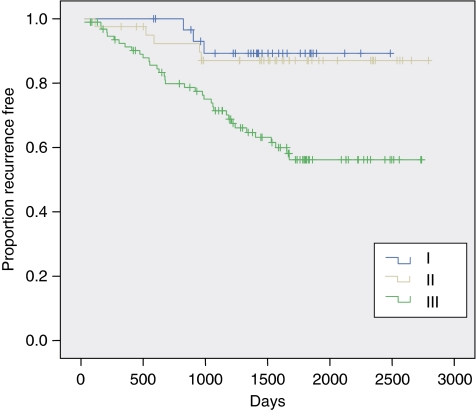
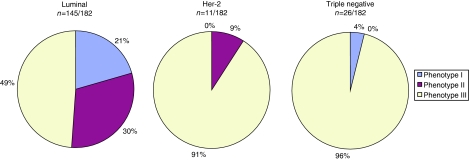
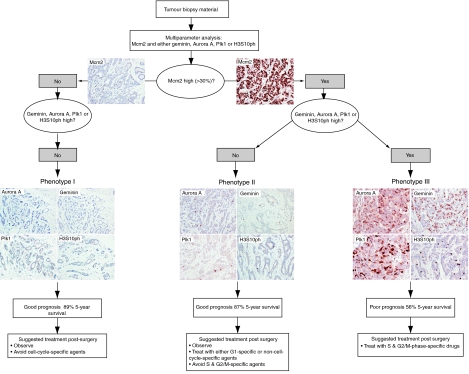
Multiparameter analysis of core regulatory proteins involved in G1-S and G2-M cell-cycle transitions provides a powerful biomarker readout for assessment of the cell-cycle state. We have applied this algorithm to breast cancer to investigate how the cell cycle impacts on disease progression. Protein expression profiles of key constituents of the DNA replication licensing pathway (Mcm2, geminin) and mitotic machinery (Plk1, Aurora A and the Aurora substrate histone H3S10ph) were generated for a cohort of 182 patients and linked to clinicopathological parameters. Arrested differentiation and genomic instability were associated with an increased engagement of cells into the cell division cycle (P<0.0001). Three unique cell-cycle phenotypes were identified: (1) well-differentiated tumours composed predominantly of Mcm2-negative cells, indicative of an out-of-cycle state (18% of cases); (2) high Mcm2-expressing tumours but with low geminin, Aurora A, Plk1 and H3S10ph levels (S-G2-M progression markers), indicative of a G1-delayed/arrested state (24% cases); and (3) high Mcm2-expressing tumours and also expressing high levels of the S-G2-M progression markers, indicative of accelerated cell-cycle progression (58% of cases). The active cell-cycle progression phenotype had a higher risk of relapse when compared with out-of-cycle and G1-delayed/arrested phenotypes (HR=3.90 (1.81-8.40, P<0.001)), and was associated with Her-2 and triple negative subtypes (P<0.001). It is of note that high-grade tumours with the G1-delayed/arrested phenotype showed an identical low risk of relapse compared with well-differentiated out-of-cycle tumours (HR=1.00 (0.22-4.46), P=0.99). Our biomarker algorithm provides novel insights into the cell-cycle state of dynamic tumour cell populations in vivo. This information is of major prognostic significance and may impact on individualised therapeutic decisions. Patients with an accelerated phenotype are more likely to derive benefit from S- and M-phase-directed chemotherapeutic agents.
Figures
References
-
- Ahlin C, Aaltonen K, Amini RM, Nevanlinna H, Fjällskog ML, Blomqvist C (2007) Ki67 and cyclin A as prognostic factors in early breast cancer. What are the optimal cut-off values? Histopathology 51: 491–498 - PubMed
-
- Anonymous (2005) Effects of chemotherapy and hormonal therapy for early breast cancer on recurrence and 15-year survival: an overview of the randomised trials. Lancet 365: 1687–1717 - PubMed
-
- Anonymous (2007) Polychemotherapy for early breast cancer: results from the international adjuvant breast cancer chemotherapy randomized trial. J Natl Cancer Inst 99: 506–515 - PubMed
-
- Barkley LR, Hong HK, Kingsbury SR, James M, Stoeber K, Williams GH (2007) Cdc6 is a rate-limiting factor for proliferative capacity during HL60 cell differentiation. Exp Cell Res 313: 3789–3799 - PubMed
Publication types
MeSH terms
Substances
LinkOut - more resources
Full Text Sources
Other Literature Sources
Medical
Research Materials
Miscellaneous
