. 2009 May;27(4):417-29.
doi: 10.1080/07357900802438585.

Modulation of effector caspase cleavage determines response of breast and lung tumor cell lines to chemotherapy

Affiliations

Modulation of effector caspase cleavage determines response of breast and lung tumor cell lines to chemotherapy

Charles A Odonkor et al. Cancer Invest. 2009 May.

Abstract

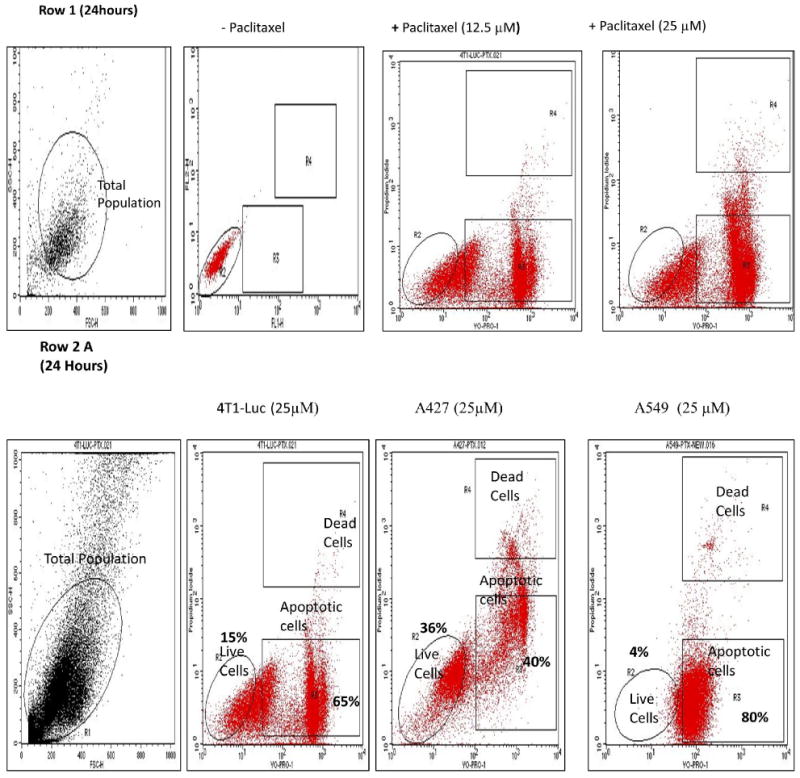
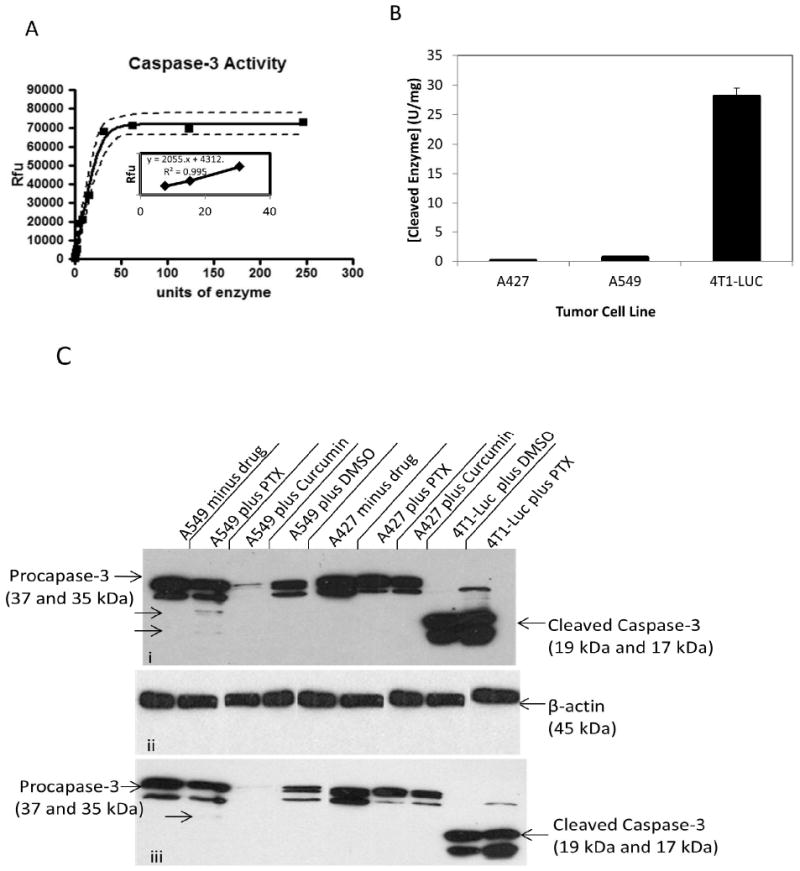
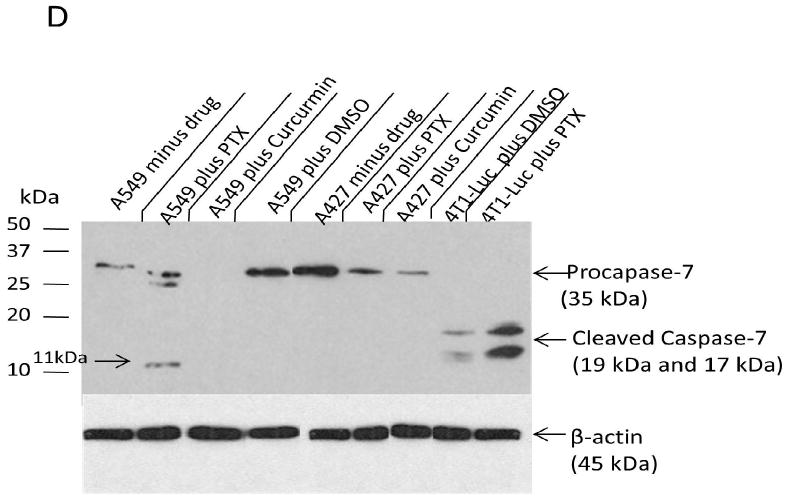
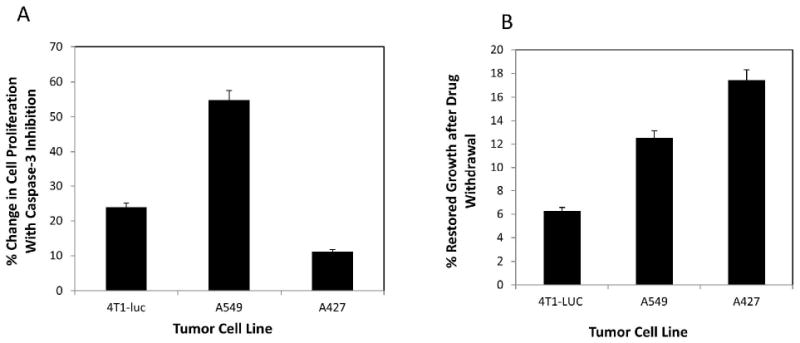
In spite of compelling evidence-implicating caspases in drug-induced apoptosis, how tumors modulate caspase expression and activity to overcome the cytotoxicity of anticancer agents is not fully understood. To address this issue, we investigated the role of caspases-3 and caspase-7 in determining the response of breast and lung tumor cell lines to chemotherapy. We found that an early and late apoptotic response correlated with weak and strong cellular caspase-activation, respectively. The results highlight an underappreciated relationship of temporal apoptotic response with caspase-activation and drug resistance. Moreover, the extent of tumor growth restoration after drug withdrawal was dependent on the degree of endogenous blockage of caspase-3 and caspase-7 cleavages. This points to an unrecognized role of caspase modulation in tumor recurrence and suggests that targeting caspase cleavage is a rational approach to increasing potency of cancer drugs.


Figures

Figure 1
Figure 1. Taxol induces a biphasic apoptotic response and increases hypodiploid nuclei in tumor cells (time and dose-dependency)
Drug treated cells (1 × 10⁶ cells/ml) were resuspended in buffer and stained by propidium iodide (PI) and YO-PRO® dyes. Nuclei staining by PI and YO-PRO® were analyzed in the FL2H/FL1H channels, respectively, of a FACSCalibur flow cytometer. A laser with 488 nm excitation was used to induce green and red fluorescence emission for YO-PRO® and PI, respectively. Hypodiploid nuclei with the former stain represent apoptotic cells. 20,000 total events were measured for each cell sample. Oval shape represents live cells within total population; top and bottom rectangles represent, dead and apoptotic cells, respectively, of the total population. Row 1: Representative FACS analyses of untreated and treated hypodiploid nuclei indicate taxol-induced apoptosis in cells in time and dose dependent fashion. Row 2: Increase in hypodiploid nuclei is cell specific. Data represents cells treated with 25 μM paclitaxel for 24 h and 48 h. (A) At 24 h the percentage of apoptotic nuclei is highest in A549-cells (80% of total), followed by 4T1-luc (65% of total), and the lowest in A427 cells (40%). (B) At 48 h, the highest percentage of apoptotic nuclei is observed in 4T-1 luc cells (80%), followed by A549 (75%), then A427 (70%). Different pattern of response at 24 h versus 48 h is indicative of an early and late phase of apoptotic response in the tumor cells and underscores different tumor response mechanisms to paclitaxel. Row 3: Comparison between groups treated for 24 h and 48 h with the same and different taxol dose reveal a time and concentration dependent response in tumor cells. The bar diagrams summarize the dose and time response at the indicated concentrations of taxol and show the mean values ± S.D. of hypodiploid nuclei with YO-PRO staining and PI-excluding cells. Statistical analysis was performed using one-way ANOVA/F-test and student's t-test to compare differences between groups. P$< 0.05 – Groups treated with the same concentration but different time points, P# < 0.05 – Groups treated with different concentrations but same time point. At 24 h, 12.5 μM of drug induces a similar response pattern as observed at 25 μM of drug- the higher apoptotic nuclei occurs in A549-cells (43%), followed by 4T1-luc (30%) and the lowest in A427 (15%). However at 48 h, a different response pattern is observed, albeit the differences % in apoptotic nuclei are minor: at 12.5 μM of drug, the highest apoptotic nuclei occurs in 4T1-luc (50%), followed by A549 (45%), and the lowest is observed in A427 (40%). The same response patter occurs at 25 μM: 4T1-Luc (80%), A549 (75%), A427 (70%).
Figure 2
Figure 2. Effector caspase-activity in breast and lung tumor cell lines correlates with apoptosis patterns
Drug treated 4T1-luc and A549 cells were stained with FLICA caspase 3 & 7 inhibitor reagent (Molecular Probes, Vybrant® FAM Caspase-3 and 7 Assay Kit). Cells were examined for caspase 3 and 7–expression by an Olympus FV 1000 microscope with a 60X/1.2M, 0.13 – 0.21 NA water immersion objective, using a 488 nm laser at 15% transmission and 535 nm emission. Green fluorescence (Ex/Em ∼ 488/530 nm) signal is direct measure of active caspase present at the time inhibitor was added. Red fluorescence (Ex/Em ∼ 535/617 nm) shows necrotic cells. At 12.5 μM of drug for 24 h : (A) Strong effector caspase activation was observed in 4T1-luc cells with a few necrotic cell populations present. (B) Weak effector caspase-activation was observed in A549-cells. (C) Representative control from non-FLICA treated samples showed no caspase detection. For the Vybrant apoptosis assay, Green Stain/YO-PRO® dye shows apoptotic cells only, red stain/Propidium iodide shows necrotic cells, while yellow stain shows both apoptotic and necrotic cells (D) 4T1-luc cells show a mixture of apoptotic, necrotic and dual stained cells, suggesting that caspase-activation by paclitaxel leads to both apoptotic and non-apoptotic forms of death in this tumor cell line. (E) A549 cells mostly show apoptotic stained cells, indicating that apoptosis is the major form of cell death induced by weak caspase-activity in this tumor cell line. (F) Representative positive control population (ethanol-treated cells) shows mostly necrotic cells with no apoptotic stained cells observed. (G) Representative negative control shows neither apoptotic nor necrotic cells.
Figure 3
Figure 3. Paclitaxel induces differential cleavage of effector caspases in tumor cell lines
Harvested cell lysates from 3-tumor lines were incubated with caspase-3 specific substrate for 1 h and fluorescence measurements taken by micro plate reader. A standard caspase-3 curve was created by reacting serially diluted purified human caspase-3 (3.28 units/mg protein) with 100 μM of Z-DEVD-AMC substrate and the resulting fluorescence measured by micro plate reader using excitation at 360± 40nm, and emission at 460 ± 40 nm. (A) Enzymatic activity of cleaved caspase-3 over 1 h period reveals steady state kinetics. Linear portion of this standard curve was used to quantify units of cleaved enzyme in the tumor cell lines. (B) Quantification of activated caspase-3 in 3-tumor cell lines shows 4T1-luc cells have the highest activation, with 28 units of cleaved enzyme. In contrast, A459 and A427 cells, have low levels of active enzyme, with 0.66 and 0.099 units of cleaved enzyme, respectively. (C) Caspase-3 cleavage is enhanced in drug-treated 4T1-luc cells, but inhibited in drug-treated A549 and A427 cells. (i) Shows 1 h X-ray exposure of blotted membrane with caspase-3 & 7 proteins, (ii) Shows β-actin internal control and (iii) Shows 10-minute exposure of same membrane from (i). Western blot analysis reveals high levels of cleaved caspase-3 in paclitaxel (PTX)- treated 4T1-luc cells as indicated by strong bands (17kDa and 19kDa) for caspase-3 activation domain. In contrast, paclitaxel (PTX) treated A549-cells showed weak cleavage of caspase-3, while A427 cells showed no observable cleavage. Treatment of A427 and A549 cells with an alternative apoptogenic compound, curcumin, produced a similar effect, with no cleaved-caspase-3 observed in these cell lines. (D) Caspase-7cleavage, like caspase-3 cleavage, is enhanced in drug-treated 4T1-luc cells, but inhibited in drug-treated A549 and A427 cells. Western blot analysis shows high levels of cleaved caspase-7 in drug treated 4T1-luc cells. In contrast, A549-cells showed weak cleavage of caspase-7, while A427 cells showed no observable cleavage.
Figure 4
Figure 4. Caspase-3 inhibition limits the anti-proliferative effect of paclitaxel on tumor cells in a cell-dependent fashion
Tumor cells cultured in 96-well plates were incubated for 10 min with a final concentration of 10 μM Ac-DEVD-CHO, a reversible caspase-3 inhibitor, then treated with varying concentrations of drug and allowed to grow for 48 h. Cell proliferation was then measured using CyQuant® Cell Proliferation assay, as previously described. Appropriate controls were performed, without inhibitor and with a nonspecific inhibitor and experiments done in triplicate. N=3. Data represent mean values ± S. D. The % change in cell proliferation was determined relative to inhibitor controls. (A) At 6.25 μM of paclitaxel, A549 cells showed the most gain with about 55% change in the number of proliferating cells, relative to controls without the inhibitor, while 4T1-luc cells showed a modest gain, with approximately 24% change in cell number, relative to controls. A427-cells benefited the least, with about 11% change in proliferation, relative to controls. This pattern was replicable at concentrations ≤ 12.5 μM, but not at concentrations ≥25 μM, perhaps due to loss of inhibition at higher drug doses. (B) To complement studies in (A), cells treated with 6.25 μM of drug, were allowed to grow for 48 h, after which drug was washed off with phosphate buffered saline and cells re-cultured for another 48 h in fresh medium. Appropriate controls with non-drug treated cells were performed and each experiment done in triplicate. N=3. % Restored Growth was computed by the formula: 100% [1- (treatment/control)]. A427, with the least effector caspase activity, showed the most favorable response, with approximately 18% growth restoration after drug withdrawal, followed by A549-cells, with 12% growth restoration, while 4T1-luc cells showed the least viability, with 6% restored growth.
Figure 5
Figure 5. Dose-dependent activation of effector caspases by paclitaxel correlates with cleavage of endogenous caspase substrate, PARP
Immunocytochemical analysis was performed to assess the in situ cleavage of the endogenous effector caspase substrate, poly-(ADP-ribose)-polymerase (PARP), by activated caspase-3 and-7. In each image, arrows point to brown spots which reflect areas of caspase-3, caspase 7 and PARP expression. (Row A) A549 cells show dose-dependent activation of caspase-3, albeit a weak expression is observed. (Row B) 4T1-luc cells show a strong ubiquitous activation of caspase-3, especially at 25 μM of paclitaxel, compared to top image of A549-cells at 25 μM of drug. (Row C) Control populations: (I) Representative positive control with ethanol treated cells show strong ubiquitous caspase-3 activation (II) Representative negative control with caspase-3 binding peptide shows no expression of cleaved caspase-3 (III) control expression in the absence of cleaved caspase-3 primary antibody. (Row D) A549 cells show weak dose-dependent activation of caspase-7. (Row E) At each indicated drug dosage, 4T1-luc cells showed stronger caspase-7 activation, compared to A549 cells (top images). (Row F) Representative Control Populations: (I) positive control with ethanol treated cells show strong ubiquitous caspase-7 activation. (II) Negative control with caspase-7 binding peptide shows no expression of cleaved caspase-3 (III) control expression in the absence of cleaved caspase-7 primary antibody. (Row G) A549 cells show dose-dependent nuclear expression of cleaved PARP. (Row H) 4T1-luc cells show regions of dense nuclear activation of PARP in a dose dependent fashion. Row (I) – I, II and III show representative positive control, negative control with PARP binding peptide and without primary PARP antibody, respectively.

Similar articles

Cited by

References

    1. Parkin DM, Bray F, Ferlay J, Pisani P. Global cancer statistics, 2002. CA Cancer J Clin. 2005;55(2):74–108. - PubMed
    1. Yoh K, Ishii G, Yokose T, et al. Breast cancer resistance protein impacts clinical outcome in platinum-based chemotherapy for advanced non-small cell lung cancer. Clin Cancer Res. 2004;10(5):1691–1697. - PubMed
    1. Gee MS, Upadhyay R, Bergquist H, et al. Multiparameter noninvasive assessment of treatment susceptibility, drug target inhibition and tumor response guides cancer treatment. Int J Cancer. 2007;121(11):2492–2500. - PubMed
    1. Janssen K, Pohlmann S, Janicke RU, Schulze-Osthoff K, Fischer U. Apaf-1 and caspase-9 deficiency prevents apoptosis in a Bax-controlled pathway and promotes clonogenic survival during paclitaxel treatment. Blood. 2007;110(10):3662–3672. - PubMed
    1. Wieder T, Essmann F, Prokop A, et al. Activation of caspase-8 in drug-induced apoptosis of B-lymphoid cells is independent of CD95/Fas receptor-ligand interaction and occurs downstream of caspase-3. Blood. 2001;97(5):1378–1387. - PubMed

Publication types

MeSH terms