. 2009;4(2):e4525.
doi: 10.1371/journal.pone.0004525. Epub 2009 Feb 26.

Metabolic profiling of the response to an oral glucose tolerance test detects subtle metabolic changes

Affiliations

Metabolic profiling of the response to an oral glucose tolerance test detects subtle metabolic changes

Suzan Wopereis et al. PLoS One. 2009.

Abstract

Background: The prevalence of overweight is increasing globally and has become a serious health problem. Low-grade chronic inflammation in overweight subjects is thought to play an important role in disease development. Novel tools to understand these processes are needed. Metabolic profiling is one such tool that can provide novel insights into the impact of treatments on metabolism.

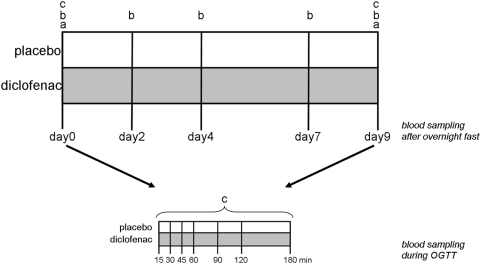
Methodology: To study the metabolic changes induced by a mild anti-inflammatory drug intervention, plasma metabolic profiling was applied in overweight human volunteers with elevated levels of the inflammatory plasma marker C-reactive protein. Liquid and gas chromatography mass spectrometric methods were used to detect high and low abundant plasma metabolites both in fasted conditions and during an oral glucose tolerance test. This is based on the concept that the resilience of the system can be assessed after perturbing a homeostatic situation.

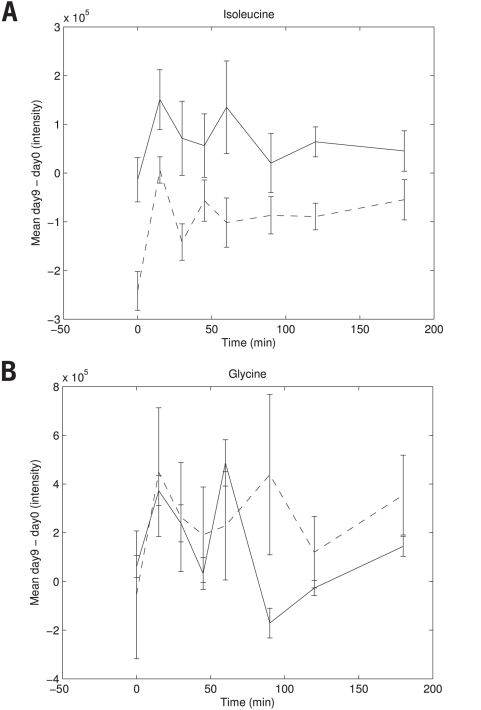
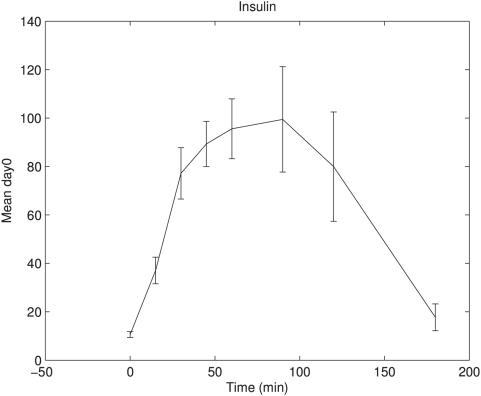
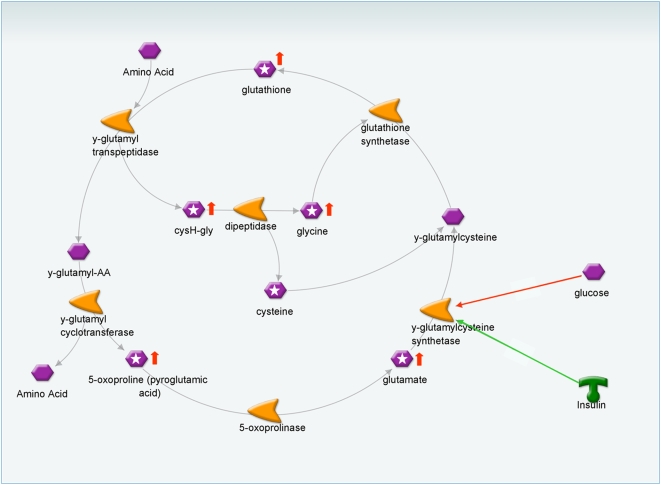
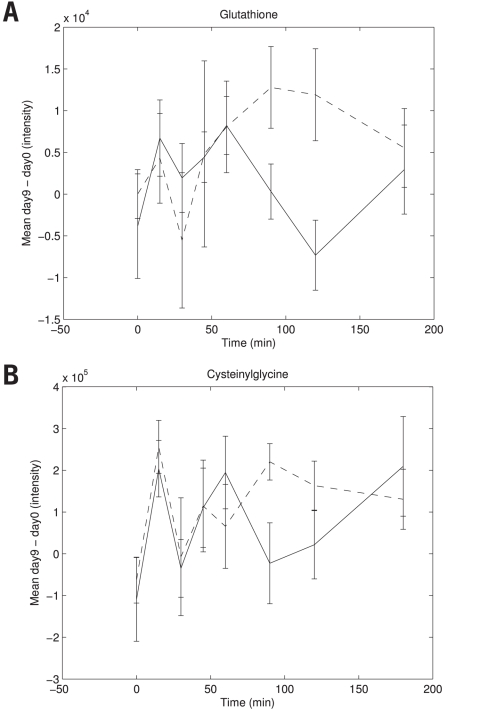
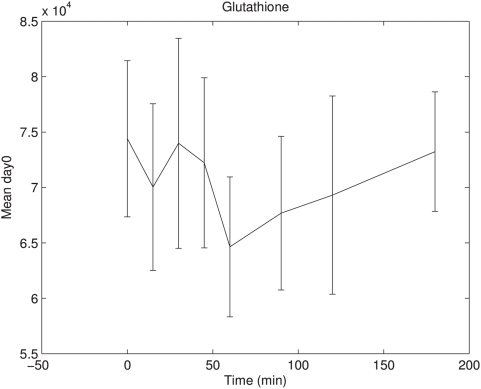
Conclusions: Metabolic changes were subtle and were only detected using metabolic profiling in combination with an oral glucose tolerance test. The repeated measurements during the oral glucose tolerance test increased statistical power, but the metabolic perturbation also revealed metabolites that respond differentially to the oral glucose tolerance test. Specifically, multiple metabolic intermediates of the glutathione synthesis pathway showed time-dependent suppression in response to the glucose challenge test. The fact that this is an insulin sensitive pathway suggests that inflammatory modulation may alter insulin signaling in overweight men.


Conflict of interest statement

Competing Interests: The authors have declared that no competing interests exist.

Figures

Figure 1
Figure 1. Overview of study design, time points at which metabolome was measured and multivariate data analyses.
To determine metabolites that were modulated by the diclofenac treatment the following multivariate data comparisons were performed to identify metabolites that were modulated by the diclofenac treatment: a) PLS-DA on metabolic profiling data from day 9 subtracted by metabolic profiling data from day 0, on fasted plasma samples; b) n-PLS-DA on metabolic profiling data from day 0, 2, 4, 7 and 9, on fasted plasma samples; c) n-PLS-DA on metabolic profiling data from day 9 subtracted by metabolic profiling data from day 0, using the fasted plasma samples and the samples after glucose administration, thus metabolic profiling data on 0, 15, 30, 45, 60, 90, 120 and 180 minutes after glucose administration. The multivariate data comparisons from a-c were performed per metabolite platform, thus multivariate models were created for GC-MS global, LC-MS polar, LC-MS lipids and LC-MS free fatty acids data.
Figure 2
Figure 2. OGTT time course mean metabolite response with standard error on day 9 corrected for concentrations on day 0 for subjects on placebo and diclofenac treatment.
A) for the metabolite isoleucine that contributes to treatment differences over the whole time course and B) for the metabolite glycine that contributes to treatment differences only in the second part of the time course. Legend to Figure 2: Dashed line: Diclofenac treated subjects; Solid line: Placebo treated subjects.
Figure 3
Figure 3. Day 0 insulin response in OGTT time course.
Day 0 insulin mean response with standard error is shown in OGTT time course for all subjects. Insulin concentrations show a maximum at ∼65 minutes after glucose intake.
Figure 4
Figure 4. Glutathione synthesis pathway and its connection to glucose and insulin.
High levels of glucose inhibit and high levels of insulin activate glutathione synthesis via the enzyme γ-glutamylcysteine synthetase. Legend to Figure 4: Connection arrows with color red represent inhibition and color green represent activation. Purple hexagons represent metabolites; purple hexagons with white star represent metabolites measured with one of the metabolic profiling platforms; orange symbols represent enzymes. Red arrows upwards indicate that higher plasma concentration levels were found in the diclofenac treated group in response to oral glucose tolerance test. Abbreviations: AA, amino acid; Cys-Gly, cysteinylglycine. These figures were created by using MapEditor version 2.1.0 (GeneGo Inc, St Joseph, MI).
Figure 5
Figure 5. Dynamic response of glutathione synthesis pathway intermediates in OGTT time course.
A) glutathione mean response with standard error on day 9 corrected for concentrations on day 0 for subjects on placebo and diclofenac treatment. Glutathione showed a treatment difference only in the second part of the time course. B) Cysteinylglycine mean response with standard error on day 9 corrected for concentrations on day 0 for subjects on placebo and diclofenac treatment. Cysteinylglycine showed a treatment difference only in the second part of the time course. Legend to Figure 5: Dashed line: Diclofenac treated subjects; Solid line: Placebo treated subjects.
Figure 6
Figure 6. Day 0 glutathione response in OGTT time course.
Day 0 glutathione mean response with standard error is shown in OGTT time course for all subjects. Glutathione showed declined concentrations in the first part of the time course with a minimum concentration at 60 minutes after glucose intake. In the second part of the time course concentrations increase again.

References

    1. Hansson GK. Mechanisms of disease: Inflammation, atherosclerosis, and coronary artery disease. New England Journal of Medicine. 2005;352:1685–1695+1626. - PubMed
    1. Dandona P, Aljada A, Bandyopadhyay A. Inflammation: The link between insulin resistance, obesity and diabetes. Trends in Immunology. 2004;25:4–7. - PubMed
    1. Fogarty AW, Glancy C, Jones S, Lewis SA, McKeever TM, et al. A prospective study of weight change and systemic inflammation over 9 y. American Journal of Clinical Nutrition. 2008;87:30–35. - PubMed
    1. Bonassi S, Neri M, Puntoni R. Validation of biomarkers as early predictors of disease. Mutat Res. 2001;480–481:349–358. - PubMed
    1. Musaad S, Haynes EN. Biomarkers of obesity and subsequent cardiovascular events. Epidemiol Rev. 2007;29:98–114. - PMC - PubMed

Publication types