. 2009;4(2):e4541.
doi: 10.1371/journal.pone.0004541. Epub 2009 Feb 26.

Unique signatures of natural background radiation on human Y chromosomes from Kerala, India

Affiliations

Unique signatures of natural background radiation on human Y chromosomes from Kerala, India

Sanjay Premi et al. PLoS One. 2009.

Abstract

Background: The most frequently observed major consequences of ionizing radiation are chromosomal lesions and cancers, although the entire genome may be affected. Owing to its haploid status and absence of recombination, the human Y chromosome is an ideal candidate to be assessed for possible genetic alterations induced by ionizing radiation. We studied the human Y chromosome in 390 males from the South Indian state of Kerala, where the level of natural background radiation (NBR) is ten-fold higher than the worldwide average, and that from 790 unexposed males as control.

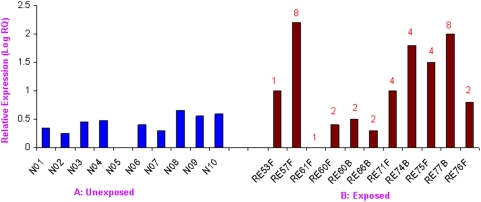
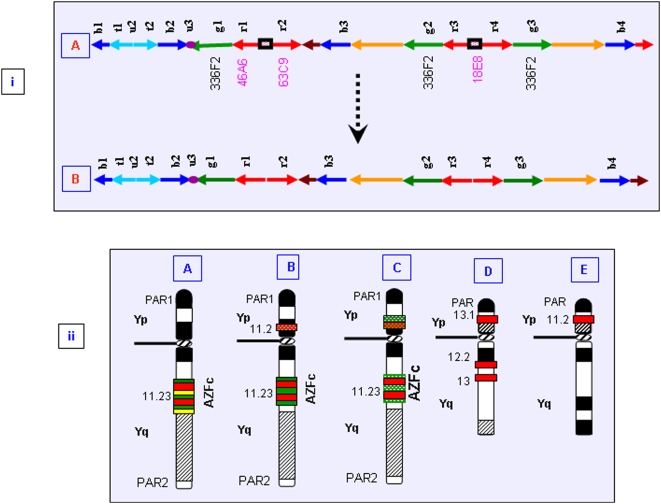
Results: We observed random microdeletions in the Azoospermia factor (AZF) a, b and c regions in >90%, and tandem duplication and copy number polymorphism (CNP) of 11 different Y-linked genes in about 80% of males exposed to NBR. The autosomal homologues of Y-linked CDY genes largely remained unaffected. Multiple polymorphic copies of the Y-linked genes showing single Y-specific signals suggested their tandem duplication. Some exposed males showed unilocus duplication of DAZ genes resulting in six copies. Notably, in the AZFa region, approximately 25% of exposed males showed deletion of the DBY gene, whereas flanking genes USP9Y and UTY remained unaffected. All these alterations were detected in blood samples but not in the germline (sperm) samples.

Conclusions: Exposure to high levels of NBR correlated with several interstitial polymorphisms of the human Y chromosome. CNPs and enhanced transcription of the SRY gene after duplication are envisaged to compensate for the loss of Y chromosome in some cells. The aforesaid changes, confined to peripheral blood lymphocytes, suggest a possible innate mechanism protecting the germline DNA from the NBR. Genome analysis of a larger population focusing on greater numbers of genes may provide new insights into the mechanisms and risks of the resultant genetic damages. The present work demonstrates unique signatures of NBR on human Y chromosomes from Kerala, India.


Conflict of interest statement

Competing Interests: The authors have declared that no competing interests exist.

Figures

Figure 1
Figure 1. PCR-based assays of STSs with DNA of a few representative males exposed to natural background radiation (NBR).
On the left of the panels, “RE” denotes radiation exposed, F and B denote father and son, respectively, and numbers refer to family IDs. The STSs are given on the right of the panels. Note de novo microdeletions in father but not in son, and vice-versa.
Figure 2
Figure 2. STS map for AZFa, b & c regions in representative exposed males.
(a) Conventional organization of the human Y chromosome. (b) STSs employed in mapping three different AZF regions are shown in corresponding colors. (c) Results of STS mapping using genomic DNA from the peripheral blood lymphocytes of the exposed males. “NM” denotes unexposed males. Sample IDs for the exposed males are given on left. “F” and “B” denote father and son, respectively. Note deletion of sY79, sY89 and sY639 in all the males and frequent deletions of sY83 and sY84 in AZFa, sY117 and sY129 in AZFb and several STSs in distal and proximal AZFc regions (see text for details).
Figure 3
Figure 3. Exclusive somatic deletion of DBY gene in ∼25% of exposed males.
(A) Representative males with their IDs shown on top. DNA from blood and semen samples are denoted as “b” and “s”, respectively. Note deletion of DBY amplicons exclusively in the blood DNA of exposed males compared to that of semen DNA. The SRY (sY14) and β-actin PCRs were used as positive controls. (B) Schematic representation of the AZFa region. Candidate AZFa genes are given in “b1”, STSs used in “b2”, and the results of screening in “b3”. Note the absence of amplicons with primers corresponding to DBY1 and DBY2.
Figure 4
Figure 4. Analysis of the AZFa HERV elements in the exposed males.
(A) Schematic representation of provirus elements with various STS markers used to study recombination mediated duplication or deletion. (B) Status of HERV elements in exposed males. Note presence of all the STSs in normal/unexposed males and randomly scattered microdeletions without any conclusive major deletion/duplication in the exposed ones. Female DNA was used as negative controls. Number of males showing deletion of a particular STS is given in percentage.
Figure 5
Figure 5. Expression of SRY gene in exposed and unexposed males based on real time PCR.
(A) Unexposed males with single copy of SRY showing variable expression in lymphocytes. Transcript levels were normalized using β-actin and RNaseP genes as internal controls, and a normal male (N05) as calibrator. (B) Exposed males showing fluctuating but conspicuously higher levels of SRY expression compared to that in normal ones, even with eight copies of the gene. The male RE61F was used as calibrator. Copy number of the SRY gene in corresponding males is given on top of each bar.
Figure 6
Figure 6. Two different copies (6F_4, 6F_11) of CDY1 gene in NBR-exposed male (6F) are shown along with its normal sequence (top).
Note the conspicuous difference between the two copies. Amino acid changes corresponding to nucleotides are highlighted in red with yellow background.
Figure 7
Figure 7. AZFc SNV/SFV typing in the exposed males.
“NBRE” refers to natural background radiation–exposed males, and numbers represent the family IDs. (A) Loss of SNV TTY4/1 allele “A” (541 bp) in exposed males (arrows in panel “A”). Sizes of digested DNA with HaeIII enzyme are given on the right. Note the absence of 541 bp band in several males. Some showed complete absence of the SNV TTY4/1. (B) SNV for BPY2 gene showing its absence in some males (arrow) and loss of allele B (289+181 bp) in others (upper panel). (C) SNV typing of GOLGA2LY gene. Note the absence of allele “A” and 289 bp of allele “B” in some males (arrows in “C”).
Figure 8
Figure 8. Structural organization of the human Y chromosome in exposed males.
Probe combinations are described in table S4. The abbreviations “fl” and “tr” refer to fluorescein and Texas red labels, respectively. Probe combination AtrBfl corresponds to dual color FISH with 18E8 in red and 63C9 in green. (a) SRY-FISH showing a single signal with varying intensities, with its multiple copies representing tandem duplication. (b) FISH with AtrBfl showing localization of probe “A” onto the proximal Yp region in all the NBR-exposed and normal males. This was substantiated using AtrCfl and AtrDfl probe combinations shown in (c) and (d), respectively. FISH with probe “D” showed exclusive localization of one of the three green amplicons onto the short arm, overlapping with the signal for probe “A”, which was substantiated using probe combinations AtrDfl, DtrCfl, and Dfl shown in (d), (e), and (f), respectively. Such localization was detected in 85–90% of exposed males. Percentage of cells showing probe D signal on the short arm was higher in the exposed males compared to unexposed ones. The ratios show percent of males to percent of cells (e.g., in probe D, panel f, 100/40% means only 40% cells of all the males showed alteration with respect to probe “D”). (g–h) Variation in length and position of Yq heterochromatin detected using 3.4 kb repeat unit of DYZ1 as FISH probe. This fluctuation was more prominent in the exposed males compared with an almost uniform signal in normal males (NM).
Figure 9
Figure 9
(i), Tandem duplication of DAZ genes in NBR-exposed males uncovered by FISH. Numbers in parentheses represent copies of DAZ genes ranging from 4–16 in the exposed males with corresponding variation in signal intensity. Sample IDs are given in square brackets. Note three signals in samples 3F, 24F and 13F, with two on one side and a single one on the other, highlighting the unilocus duplication of DAZ genes (see text for details). (ii), Organization of DAZ genes in exposed males. Only six representative exposed males and a normal one (Nm) are shown, with their sample IDs on top, copies of DAZ in parentheses, and probes on the right of the panels. The normal male (Nm) showed the expected number of discernible signals for each probe (A–E) with combinations of AtrBfl and AtrCfl separating two signals. Exposed males showed higher DAZ copies corresponding to unilocus (RE53F & RE53B) or bilocus duplications (RE52F, RE54F, RE54B, & RE56F) evident from the number and intensity of the corresponding signals shown in (A), (B) and (D), respectively. Similarly, probe “D” specific for green amplicons showed three expected signals overlapping “B” with “C” in normal males. In exposed males, 80–90% of cells showed unexpected overlap of probe “D” signal with that of “A” (RE53F, 54F & 56F), as shown in (C). Presence of three signals with probe D was confirmed by different probe combinations as shown in (D) and (E). (F) Schematic map of the AZFc amplicons given as a reference.
Figure 10
Figure 10. (i), Schematic representation of the AZFc region.
(A) Arrangement of the AZFc amplicons as reported in the literature. Probes used in this study are given below the corresponding amplicons. Cosmids common to all the DAZ genes are highlighted in pink. (B) Arrangement of the AZFc amplicons in the NBR-exposed and control males showing decreased intervening length between the two DAZ genes at each locus. This decrease is hypothesized to be due to translocation of 18E8 sequences onto the Yp. (ii), (A) Diagrammatic illustration showing positions of DAZ genes and neighboring AZFc amplicons reported thus far. Red horizontal bars represent two DAZ loci. The amplicons g1, g2, and g3, detected with BAC 336F2 (probe D) are represented by green horizontal bars. (B) Translocation of probe “A” signal to the Yp shown as red dotted horizontal bar. (C) Duplication of either one or all the g1, g2, and g3 amplicons followed by translocation to the short arm with higher frequency in NBR-exposed males compared to that in normal ones. (D) and (E) represent Y chromosomes of Sumatran orangutan and pygmy chimpanzee, respectively, where DAZ genes are present on the short arm of the Y chromosome. The Yp localization of DAZ genes was not linked with the exposure to NBR, since a similar arrangement was detected in the normal males.
Figure 11
Figure 11. Loss of Y chromosome in 10–15% of cells in NBR-exposed males.
Details of probes and probe combinations labeled with red (Texas red, tr) or green (fluorescein, fl) are given in parentheses. Probe symbols (A–D) are the same as given in Figures 1 and 2. SRY probe combination hybridizes simultaneously to SRY gene on the Y (Yp11.3) and centromeric region of the X chromosome (DXZ1). WCP refers to whole chromosome painting showing loss of the Y chromosome (arrows).

Similar articles

Cited by

References

    1. Sankaranarayanan K. Ionizing radiations and genetic risks X. The potential “disease phenotypes” of radiation-induced genetic damage in humans: perspectives from human molecular biology and radiation genetics. Mutation Research. 1999;429:45–83. - PubMed
    1. 1993. UNSCEAR United Nations Scientific Committee on the Effects of Atomic Radiations, The 1993 Report to the General Assembly WITH Scientific Annexes, United Nations, New York 1993.
    1. Dubrova YE, Bersimbaev RI, Djansugurova LB, Tankimanova MK, Mamyrbaeva ZZ, et al. Nuclear weapons tests and human germline mutation rate. Science. 2002;295:1037. - PubMed
    1. Hande MP, Azizova TV, Geard CR, Burak LE, Mitchell CR, et al. Past exposure to densely ionizing radiation leaves a unique permanent signature in the genome. Am J Hum Genet. 2003;72:1162–1170. - PMC - PubMed
    1. Kuzin AM, Slozhenikina LV, Fialkovaskaia LA, Primak-Miroliubov VN. possible effect of natural background radiation on the development of mammals. Radiobiologiia. 1983;23:192–195. - PubMed

Publication types