. 2009 Feb;5(2):e1000287.
doi: 10.1371/journal.pcbi.1000287. Epub 2009 Feb 13.

Signaling logic of activity-triggered dendritic protein synthesis: an mTOR gate but not a feedback switch

Affiliations

Signaling logic of activity-triggered dendritic protein synthesis: an mTOR gate but not a feedback switch

Pragati Jain et al. PLoS Comput Biol. 2009 Feb.

Abstract

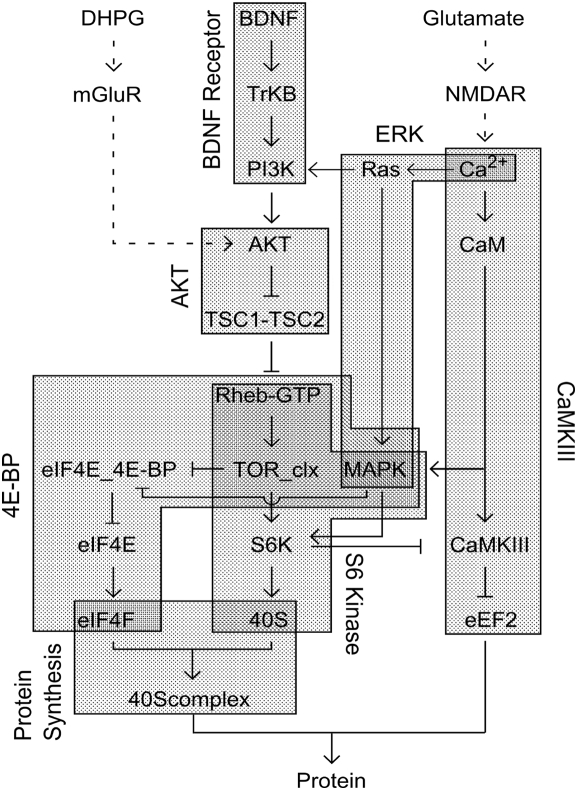
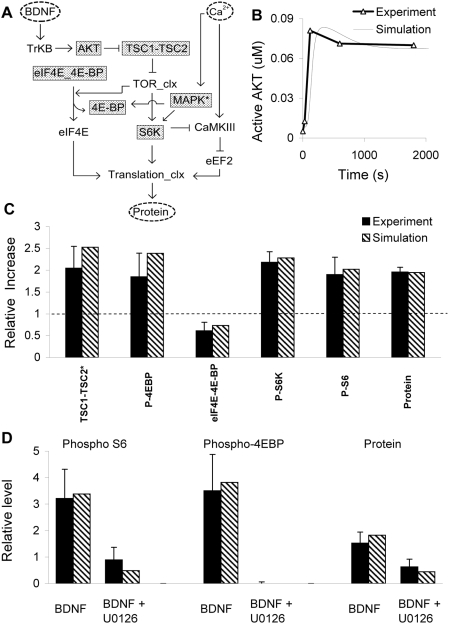
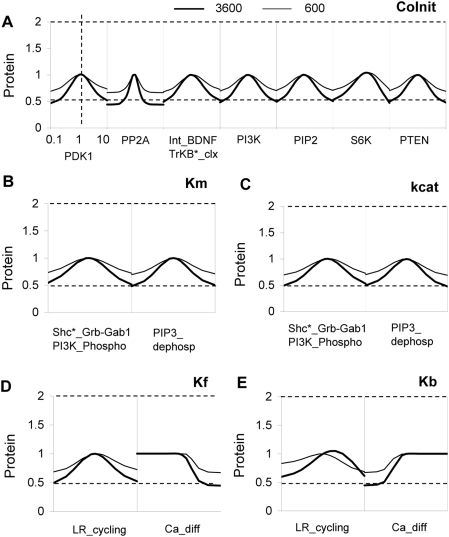
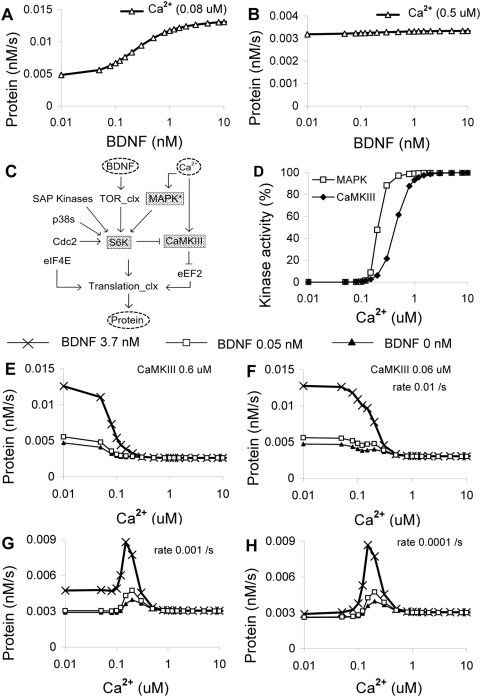
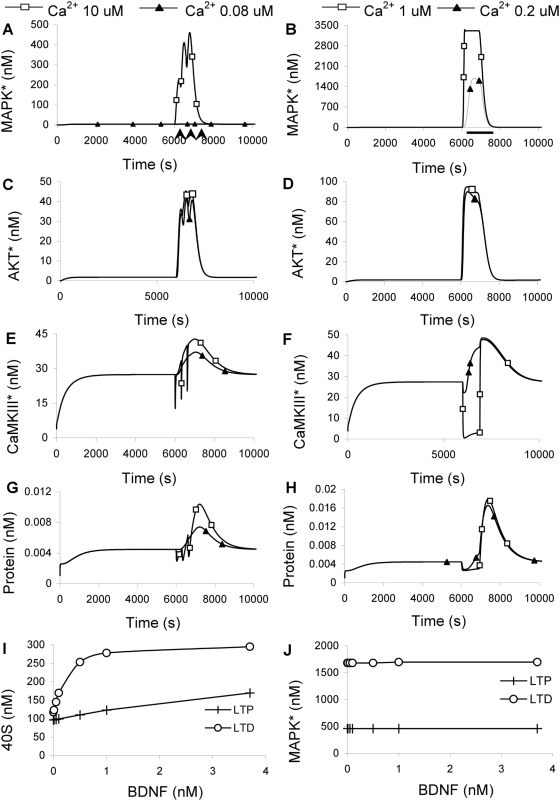
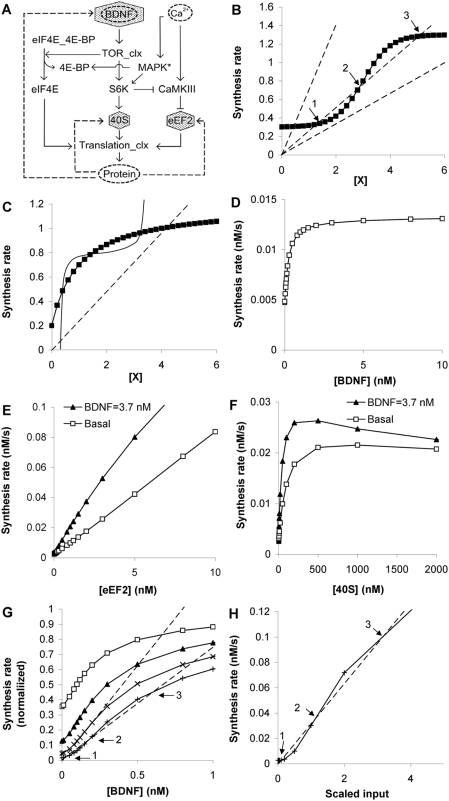
Changes in synaptic efficacy are believed to form the cellular basis for memory. Protein synthesis in dendrites is needed to consolidate long-term synaptic changes. Many signals converge to regulate dendritic protein synthesis, including synaptic and cellular activity, and growth factors. The coordination of these multiple inputs is especially intriguing because the synthetic and control pathways themselves are among the synthesized proteins. We have modeled this system to study its molecular logic and to understand how runaway feedback is avoided. We show that growth factors such as brain-derived neurotrophic factor (BDNF) gate activity-triggered protein synthesis via mammalian target of rapamycin (mTOR). We also show that bistability is unlikely to arise from the major protein synthesis pathways in our model, even though these include several positive feedback loops. We propose that these gating and stability properties may serve to suppress runaway activation of the pathway, while preserving the key role of responsiveness to multiple sources of input.


Conflict of interest statement

The authors have declared that no competing interests exist.

Figures

Figure 1
Figure 1. Block diagram of signaling network.
Inputs are located at the top. The primary input to the pathway is BDNF. We use Ca2+ influx as a surrogate for glutamate input, and AKT activation as equivalent to input from the mGluR5 pathway, since it is still incompletely understood. Dashed arrows represent such virtual inputs. Regular arrows represent positive interactions and T-s represent inhibitory inputs. The various modules in the model are represented as gray blocks, and their names are in rotated text.
Figure 2
Figure 2. BDNF and AKT signaling.
(A) Chemical reaction diagram of BDNF input module, terminating on PIP3 production. Molecules in shaded gray ovals are used as readouts for constraining the module. (B) Time-course of TrKB2 phosphorylation following BDNF (200 ng/ml) stimulation . (C) Dose-response of Shc phosphorylation as a function of BDNF stimulus . (D) Dose-response of PLC-γ phosphorylation as a function of BDNF stimulus . (E) Chemical reaction diagram of AKT module, terminating in Rheb-GTP formation. (F) Time-course of AKT phosphorylation following PIP3 input .
Figure 3
Figure 3. TOR signaling.
(A) Chemical reaction diagram of S6K regulation culminating in 40S phosphorylation. (B) S6K phosphorylation as a function of TOR levels . (C) 40S phosphorylation as a function of preincubation time of TOR and S6K (0.5, 10, 20, 30, and 45 min) . (D) 40S phosphorylation is stimulated 10 fold by PDK1 . (E) Chemical reaction diagram of eIF4E regulation, culminating in formation of the eIF4F-mRNA complex. (F) Time-course of eIF4E-BP complex formation .
Figure 4
Figure 4. CaMKIII and translation complex modules.
(A) Chemical reaction diagram of CaMKIII activation by Ca2+, culminating in eEF2 inhibition. (B) Dose-response curve for activation of CaMKIII by CaM-Ca4, as measured by eEF2 phosphorylation . (C) Time-course of CaMKIII phosphorylation following S6 Kinase incubation . (D) Time-course of eEF2-thr36 dephosphorylation following PP2A incubation . (E) Chemical reaction diagram of final stages of translation complex formation, leading to protein synthesis. (F) Dose-response curve for 40S complex formation as a function of 40S concentration .
Figure 5
Figure 5. Composite pathway validation.
(A) Simplified block diagram of composite pathway, showing key readout molecules. (B) Time-course of AKT activation following sustained BDNF stimulation at 2 nM . (C) Relative increase in levels of various pathway readouts: TSC1-TSC2* (phosphorylated form of TSC1-TSC2), P-4EBP (sum total of the phosphorylated forms of 4E-BP), eIF4E-4E-BP (inactive form of eIF4E), P-S6K (sum total of the phosphorylated forms of S6K), P-S6 (phosphorylated form of 40S) and protein. The readouts except protein were measured after 10 minutes and protein was measured after 30 minutes following the addition of 3.7 nM BDNF . The dotted line represents the value of read-outs without any stimulus (control) (D) Relative increase in levels of phosphoS6 (phosphorylated form of 40S), phospho-4EBP (doubly phosphorylated form of eIF4E_4E-BP), and protein, measured after 4 hr following 100 ng/mL BDNF stimulation for 4 hr, in control and MAPK KO mice .
Figure 6
Figure 6. Parameter sensitivity analysis.
We systematically varied all parameters from 0.1 to 10 fold the original model value. In all panels, the protein synthesis rate is plotted as a ratio to baseline, as measured at 600 sec (thin line) and 3600 sec (thick line). Here we plot the parameters that result in a change of at least a factor of two. (A) Dependence on initial concentration. (B) Dependence on Km, for enzyme reactions. (C) Dependence on kcat, for enzyme reactions. (D) Dependence on Kf, for binding or conversion reactions. (E) Dependence on Kb, for binding or conversion reactions. In all cases the synthesis rate does not change by more than 2.5 fold.
Figure 7
Figure 7. Steady-state responses to BDNF and Ca2+.
(A,B) Protein synthesis rate as a function of BDNF level, at 0.08 and 0.5 µM Ca2+ respectively. (C) Simplified block diagram, indicating manipulated molecules in gray. (D) Comparison of activation curves for MAPK (phosphorylated form) and CaMKIII (CaM-Ca4 bound form) response to Ca2+. (E,F) Protein synthesis rates as a function of Ca2+, at two different levels of CaMKIII (0.6 µM (E), 0.06 µM (F)), both with a S6K phosphorylation rate of 0.01. There is a modest shift in Ca2+ dependence for the 3.7 nM BDNF case. (G,H) Reduced basal phosphorylation of S6K from 0.01 to 0.001 (G) or 0.0001 (H) converts the Ca2+ responses to a narrow bell-curve gated by BDNF.
Figure 8
Figure 8. Responses to LTP and LTD stimuli.
In (A–F) the LTP responses are on the left and LTD on the right. LTP stimulus was 3 Ca2+ peaks of 10 µM for 1 sec each, separated by 5 min, accompanied by BDNF input at 3.7 nM for 5 sec each (Arrows below time axis in (A)). Filled triangles indicate runs where the Ca2+ remained at baseline (0.08 µM) and only the BDNF stimulus was given. The LTD stimulus (Bar below time axis in (B)) was a single pulse of Ca2+ for 900 sec at 1 µM (open squares) and 0.2 µM Ca2+ (filled triangles). BDNF was a single 900 sec pulse at 3.7 nM. (A,B) MAPK activation. (C,D) AKT activation. (E,F) CaMKIII activation. (G,H) Protein synthesis. (I) Peak 40S as a function of BDNF levels for the LTD and LTP stimuli, at 0.2 and 10 µM Ca2+, respectively. The LTD stimulus gives nearly twice the 40S levels except at very low BDNF. (J) Peak MAPK activation by LTD and LTP stimuli, at 0.2 and 10 µM Ca2+, respectively. MAPK responds more strongly to the LTD stimulus, and is not sensitive to BDNF levels.
Figure 9
Figure 9. Feedback.
(A) Three possible feedback pathways, indicated by dashed lines. 40S and eEF2 are produced by 5′TOP mRNAs and are involved in the protein synthesis machinery itself. BDNF is produced by the CAP mRNAs and is one of the key stimulus molecules for this pathway. (B) Bistability is possible with a steeply sigmoid dose-response curve (filled squares) if the input molecule X is a fraction of the total protein synthesis (dashed lines). This fraction F must be in an intermediate range such that the line cuts the sigmoid thrice (arrows). Points 1 and 3 are lower and upper stable points, and point 2 is an unstable point. (C) Bistability is not possible with a simple saturating dose-response curve (filled squares), when X is a fraction of protein synthesis (dashed line). It is only possible when X is itself formed in some steeply sigmoid manner as a function of synthesis rate, so as to give rise to three intersecting points (smooth line). (D) Protein synthesis rate as a function of BDNF stimulus. (E) Protein synthesis rate as a function of eEF2 levels, at basal (0.1 nM) and stimulated (3.7 nM) BDNF. (F) Protein synthesis rate as a function of 40S ribosomal subunit levels, again at basal and stimulated BDNF. None of (D), (E), or (F) can be bistable if the input molecule is produced in a linear proportion of total protein synthesis. (G) Bistability may be possible for 4th order response curves. We normalized the BDNF response curve to a maximum of 1. We took powers of 1 to 4 of this curve (Squares, triangles, crosses and plus signs, respectively), and looked for sigmoidal shapes. The 3rd power curve did not quite show bistability, but the 4th power did (arrows as in (B)). (H) Synergistic effects of BDNF, eEF2 and 40S might show bistability (arrows as in (B)). We computed the dose response curve with scaled input (in nM) as follows: BDNF = input * 0.2; eEF2 = input * 1000, 40S = input * 100.

Similar articles

Cited by

References

    1. Sutton MA, Schuman EM. Dendritic protein synthesis, synaptic plasticity, and memory. Cell. 2006;127:49–58. - PubMed
    1. Schuman EM, Dynes JL, Steward O. Synaptic regulation of translation of dendritic mRNAs. J Neurosci. 2006;26:7143–7146. - PMC - PubMed
    1. Tang SJ, Schuman EM. Protein synthesis in the dendrite. Philos Trans R Soc Lond B Biol Sci. 2002;357:521–529. - PMC - PubMed
    1. Bramham CR, Wells DG. Dendritic mRNA: transport, translation and function. Nat Rev Neurosci. 2007;8:776–789. - PubMed
    1. Klann E, Antion MD, Banko JL, Hou L. Synaptic plasticity and translation initiation. Learn Mem. 2004;11:365–372. - PubMed

Publication types