Monitoring of tumor promotion and progression in a mouse model of inflammation-induced colon cancer with magnetic resonance colonography
- PMID: 19242605
- PMCID: PMC2647726
- DOI: 10.1593/neo.81326
Monitoring of tumor promotion and progression in a mouse model of inflammation-induced colon cancer with magnetic resonance colonography
Abstract
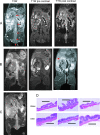
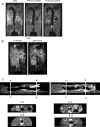
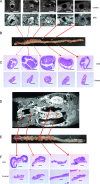
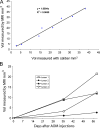
Early detection of precancerous tissue has significantly improved survival of most cancers including colorectal cancer (CRC). Animal models designed to study the early stages of cancer are valuable for identifying molecular events and response indicators that correlate with the onset of disease. The goal of this work was to investigate magnetic resonance (MR) colonography in a mouse model of CRC on a clinical MR imager. Mice treated with azoxymethane and dextran sulfate sodium were imaged by serial MR colonography (MRC) from initiation to euthanasia. Magnetic resonance colonography was obtained with both T1- and T2-weighted images after administration of a Fluorinert enema to remove residual luminal signal and intravenous contrast to enhance the colon wall. Individual tumor volumes were calculated and validated ex vivo. The Fluorinert enema provided a clear differentiation of the lumen of the colon from the mucosal lining. Inflammation was detected 3 days after dextran sulfate sodium exposure and subsided during the next week. Tumors as small as 1.2 mm(3) were detected and as early as 29 days after initiation. Individual tumor growths were followed over time, and tumor volumes were measured by MR imaging correlated with volumes measured ex vivo. The use of a Fluorinert enema during MRC in mice is critical for differentiating mural processes from intraluminal debris. Magnetic resonance colonography with Fluorinert enema and intravenous contrast enhancement will be useful in the study of the initial stages of colon cancer and will reduce the number of animals needed for preclinical trials of prevention or intervention.
Figures


Similar articles
-
In vivo MRI virtual colonography in a mouse model of colon cancer.Nat Protoc. 2014 Nov;9(11):2682-92. doi: 10.1038/nprot.2014.178. Epub 2014 Oct 23. Nat Protoc. 2014. PMID: 25340441 Free PMC article.
-
Colorectal neoplasm: magnetic resonance colonography with fat enema-initial clinical experience.World J Gastroenterol. 2007 Oct 28;13(40):5371-5. doi: 10.3748/wjg.v13.i40.5371. World J Gastroenterol. 2007. PMID: 17879409 Free PMC article. Clinical Trial.
-
Magnetic resonance colonography with intestine-absorbable nanoparticle contrast agents in evaluation of colorectal inflammation.Eur Radiol. 2021 Jul;31(7):4615-4624. doi: 10.1007/s00330-020-07609-8. Epub 2021 Jan 6. Eur Radiol. 2021. PMID: 33409796 Free PMC article.
-
[Magnetic resonance colonography: a new diagnostic tool].Ugeskr Laeger. 2005 Nov 7;167(45):4279-84. Ugeskr Laeger. 2005. PMID: 16277930 Review. Danish.
-
History, evolution, and current status of radiologic imaging tests for colorectal cancer screening.Radiology. 2014 Nov;273(2 Suppl):S160-80. doi: 10.1148/radiol.14140531. Radiology. 2014. PMID: 25340435 Review.
Cited by
-
A feasibility study of parametric response map analysis of diffusion-weighted magnetic resonance imaging scans of head and neck cancer patients for providing early detection of therapeutic efficacy.Transl Oncol. 2009 Aug 18;2(3):184-90. doi: 10.1593/tlo.09175. Transl Oncol. 2009. PMID: 19701503 Free PMC article.
-
A simple, quantitative method using alginate gel to determine rat colonic tumor volume in vivo.Comp Med. 2014 Apr;64(2):128-34. Comp Med. 2014. PMID: 24674588 Free PMC article.
-
Grape seed extract efficacy against azoxymethane-induced colon tumorigenesis in A/J mice: interlinking miRNA with cytokine signaling and inflammation.Cancer Prev Res (Phila). 2013 Jul;6(7):625-33. doi: 10.1158/1940-6207.CAPR-13-0053. Epub 2013 May 2. Cancer Prev Res (Phila). 2013. PMID: 23639480 Free PMC article.
-
The interconnectedness of cancer cell signaling.Neoplasia. 2011 Dec;13(12):1183-93. doi: 10.1593/neo.111746. Neoplasia. 2011. PMID: 22241964 Free PMC article.
-
Tumor models to assess immune response and tumor-microbiome interactions in colorectal cancer.Pharmacol Ther. 2022 Mar;231:107981. doi: 10.1016/j.pharmthera.2021.107981. Epub 2021 Sep 2. Pharmacol Ther. 2022. PMID: 34480964 Free PMC article. Review.
References
-
- Jemal A, Siegel R, Ward E, Hao Y, Xu J, Murray T, Thun MJ. Cancer statistics, 2008. CA Cancer J Clin. 2008;58:71–96. - PubMed
-
- Meissner HI, Breen N, Klabunde CN, Vernon SW. Patterns of colorectal cancer screening uptake among men and women in the United States. Cancer Epidemiol Biomarkers Prev. 2006;15:389–394. - PubMed
-
- Ries LA, Wingo PA, Miller DS, Howe HL, Weir HK, Rosenberg HM, Vernon SW, Cronin K, Edwards BK. The annual report to the nation on the status of cancer, 1973–1997, with a special section on colorectal cancer. Cancer. 2000;88:2398–2424. - PubMed
MeSH terms
Substances
LinkOut - more resources
Full Text Sources
Other Literature Sources
Medical
