Review
. 2009 Mar;104(2):149-56.
doi: 10.1007/s00395-009-0002-x. Epub 2009 Feb 26.

Cardioprotection and altered mitochondrial adenine nucleotide transport

Affiliations
Review

Cardioprotection and altered mitochondrial adenine nucleotide transport

Charles Steenbergen et al. Basic Res Cardiol. 2009 Mar.

Abstract

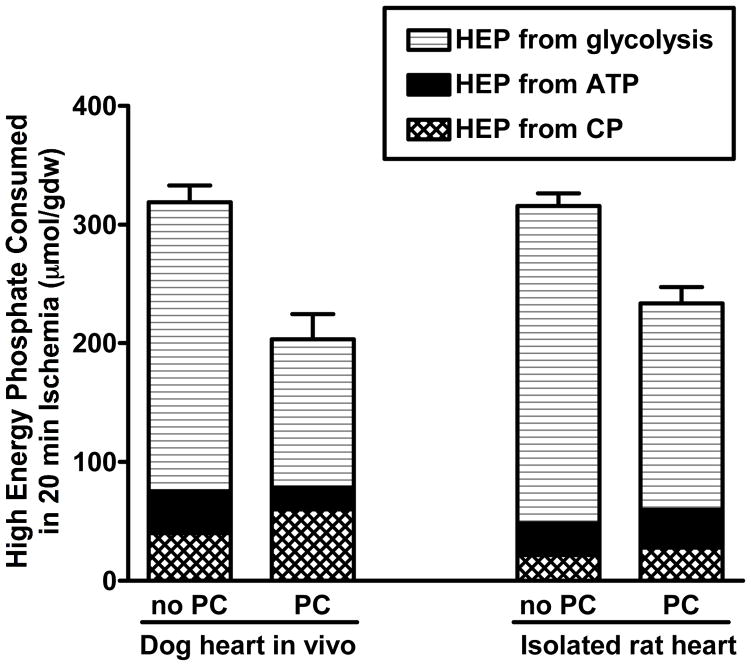
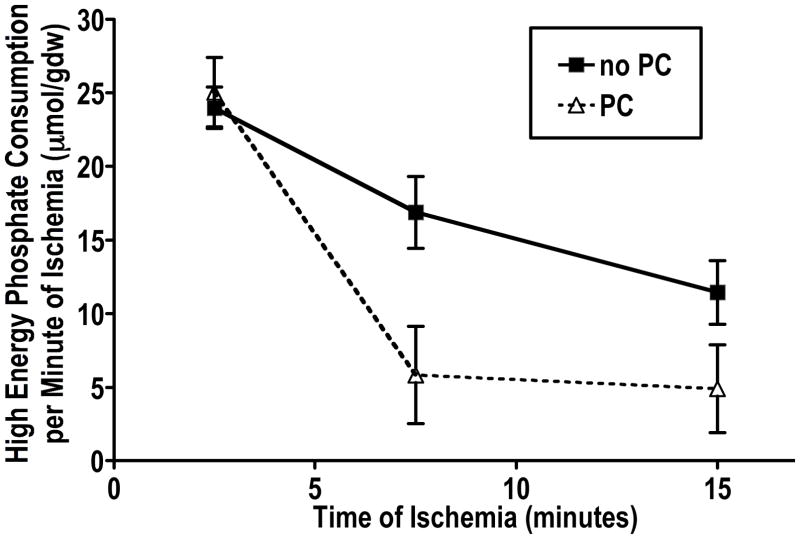
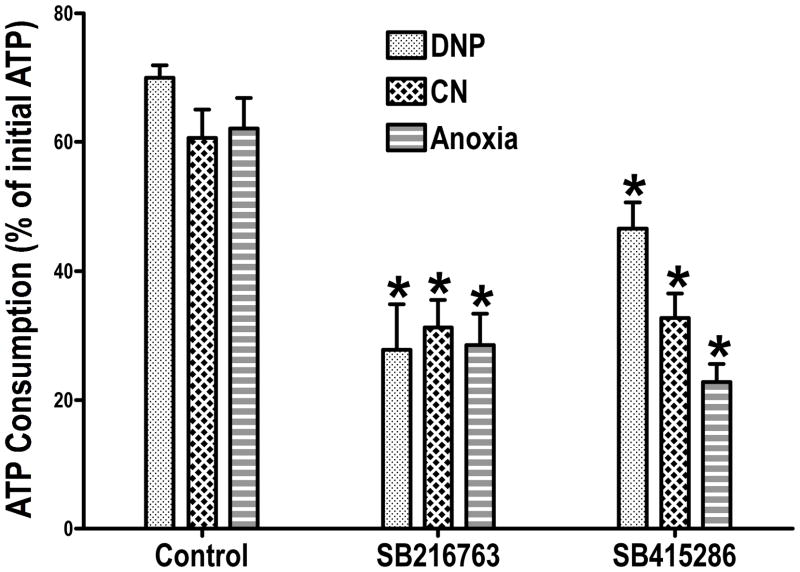
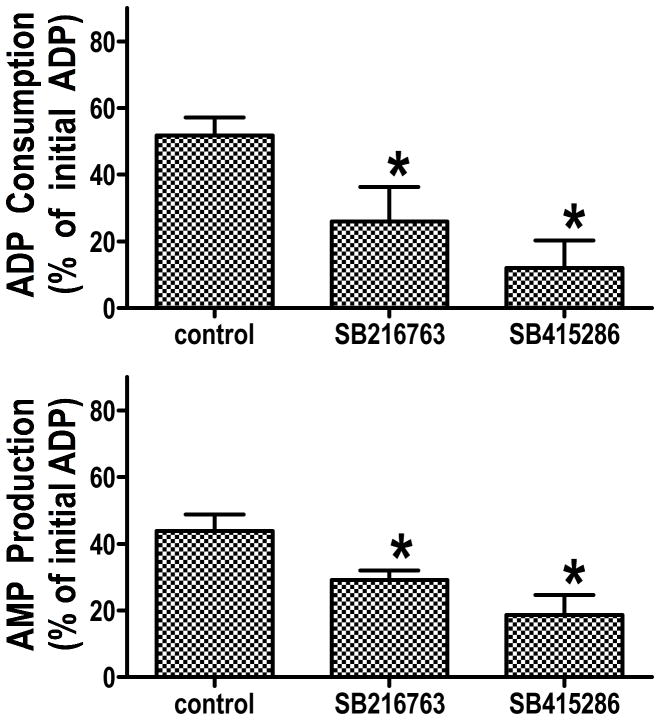
It is becoming increasingly clear that mitochondrial dysfunction is critically important in myocardial ischemic injury, and that cardioprotective mechanisms must ultimately prevent or attenuate mitochondrial damage. Mitochondria are also essential for energy production, and therefore prevention of mitochondrial injury must not compromise oxidative phosphorylation during reperfusion. This review will focus on one mitochondrial mechanism of cardioprotection involving inhibition of adenine nucleotide transport across the outer mitochondria membrane under de-energized conditions. This slows ATP hydrolysis by the mitochondria, and would be expected to lower mitochondrial membrane potential during ischemia, to inhibit calcium uptake during ischemia, and potentially to reduce free radical generation during early reperfusion. Two interventions that similarly inhibit mitochondrial adenine nucleotide transport are Bcl-2 overexpression and GSK inhibition. A possible final common mechanism shared by both of these interventions is discussed.


Figures

Figure 1
Figure 1
Total amount of high-energy phosphate consumed in severely or totally ischemic myocardium during 20 minutes of ischemia. The total amount of high energy phosphate consumed is equal to the amount of ATP produced by anaerobic glycolysis and the amount of high energy phosphate that is derived from tissue reserves of ATP and creatine phosphate. For this calculation, it was assumed that the flux through anaerobic glycolysis is equal to the change in tissue lactate and that the lactate came from glycogen, which yield 1.5 high-energy phosphates per lactate. Creatine phosphate breakdown yields 1 high energy phosphate, ATP yields 2, and ADP yields 1. This calculation is described in more detail in Murry et al, and the data for the dog heart is taken from the same source. Data for the isolated rat heart was obtained from analysis of tissue extracts, using the same assays as for the dog heart. For both the dog and rat experiments, preconditioning consisted of 4 cycles of 5 minutes of ischemia and 5 minutes of reperfusion.
Figure 2
Figure 2
The data are obtained from Murry et al, as described in Figure 1. The value at each time point is obtained from the changes in lactate, ATP, ADP, and creatine phosphate. The value for 2.5 minutes reflects the difference from time 0 to 5 minutes of ischemia. The value for 7.5 minutes reflects the difference from 5 to 10 minutes of ischemia, and the value for 15 minutes reflects the difference from 10 to 20 minutes of ischemia. The data are replotted from Figure 12 of Murry et al.
Figure 3
Figure 3
The data are replotted from Das et al, Figure 2. For the dinitrophenol (DNP) group, ATP consumption was measured after 5 minutes of incubation. For the cyanide (CN) group, ATP consumption was measured after 20 minutes of incubation. For the anoxia group, ATP consumption was measured after 60 minutes of incubation. Details are in Das et al.
Figure 4
Figure 4
Diagramatic scheme of the assay for VDAC transport of adenine nucleotides. ADP is added to the medium and the amount of ADP consumed and the amount of AMP produced is measured. More details are available in Das et al.
Figure 5
Figure 5
The data are obtained from Das et al. Cyanide and oligomycin were added for 20 minutes, and then ADP was added and the mitochondria were incubated for an additional 10 minutes. At the end of the incubation, the mitochondria were pelleted and the amount of ADP remaining in the medium and the amount of AMP in the medium was measured. ADP consumption is the difference between the amount of ADP added and the amount of ADP remaining at the end of incubation.
Figure 6
Figure 6
Possible mechanisms of GSK regulation of VDAC phosphorylation.

References

    1. Murry CE, Jennings RB, Reimer KA. Preconditioning with ischemia: a delay of lethal cell injury in ischemic myocardium. Circulation. 1986;74(5):1124–1136. - PubMed
    1. Murry CE, Richard VJ, Reimer KA, Jennings RB. Ischemic preconditioning slows energy metabolism and delays ultrastructural damage during a sustained ischemic episode. Circ Res. 1990;66(4):913–931. - PubMed
    1. Steenbergen C, Perlman ME, London RE, Murphy E. Mechanism of preconditioning. Ionic alterations. Circ Res. 1993;72(1):112–125. - PubMed
    1. Asimakis GK, Inners-McBride K, Medellin G, Conti VR. Ischemic preconditioning attenuates acidosis and postischemic dysfunction in isolated rat heart. Am J Physiol. 1992;263(3 Pt 2):H887–894. - PubMed
    1. Imahashi K, Schneider MD, Steenbergen C, Murphy E. Transgenic expression of Bcl-2 modulates energy metabolism, prevents cytosolic acidification during ischemia, and reduces ischemia/reperfusion injury. Circ Res. 2004;95(7):734–741. - PubMed

MeSH terms