. 2009 Feb 24;7(2):e41.
doi: 10.1371/journal.pbio.1000041.

Neto1 is a novel CUB-domain NMDA receptor-interacting protein required for synaptic plasticity and learning

Affiliations

Neto1 is a novel CUB-domain NMDA receptor-interacting protein required for synaptic plasticity and learning

David Ng et al. PLoS Biol. .

Abstract

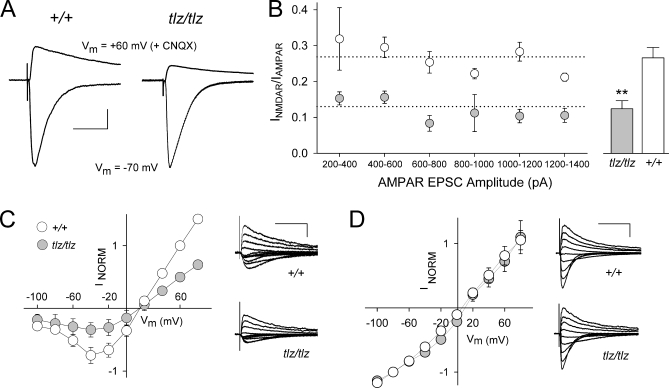
The N-methyl-D-aspartate receptor (NMDAR), a major excitatory ligand-gated ion channel in the central nervous system (CNS), is a principal mediator of synaptic plasticity. Here we report that neuropilin tolloid-like 1 (Neto1), a complement C1r/C1s, Uegf, Bmp1 (CUB) domain-containing transmembrane protein, is a novel component of the NMDAR complex critical for maintaining the abundance of NR2A-containing NMDARs in the postsynaptic density. Neto1-null mice have depressed long-term potentiation (LTP) at Schaffer collateral-CA1 synapses, with the subunit dependency of LTP induction switching from the normal predominance of NR2A- to NR2B-NMDARs. NMDAR-dependent spatial learning and memory is depressed in Neto1-null mice, indicating that Neto1 regulates NMDA receptor-dependent synaptic plasticity and cognition. Remarkably, we also found that the deficits in LTP, learning, and memory in Neto1-null mice were rescued by the ampakine CX546 at doses without effect in wild-type. Together, our results establish the principle that auxiliary proteins are required for the normal abundance of NMDAR subunits at synapses, and demonstrate that an inherited learning defect can be rescued pharmacologically, a finding with therapeutic implications for humans.


Conflict of interest statement

Competing interests. The authors have declared that no competing interests exist.

Figures

Figure 1
Figure 1. Neto1, a CUB-Domain Transmembrane Protein Expressed in the Brain
(A) Domain organization of the predominant isoform of Neto1 and related CUB-domain proteins. (B–D) In situ hybridization for Neto1 mRNA in adult wild-type brain sections. (B) Coronal. (C) Enlarged region of hippocampus. (D) Sagittal. am, amygdala; CA1 and CA3, pyramidal neurons of Cornu Ammonis regions 1 and 3; cb, cerebellum; cor, cerebral cortex; cp, caudate-putamen; dg, dentate gyrus; ect, entorhinal cortex; hip, hippocampus; ht, hypothalamus; o, olfactory bulb; ot, olfactory tubercle; p, pons. Scale bar: 1 mm.
Figure 2
Figure 2. Neto1 is a PSD Protein Localized to Dendritic Spines and Interacts with PSD-95 through a C-Terminal PDZ Tripeptide
(A) Subcellular fractionation profile of Neto1, PSD-95, NR1, and VAMP2. H, homogenate; LP1, synaptosomal membrane fraction; LP1–1, LP1–2 (synaptic plasma membranes), and LP1–3 designate the bands located at the interfaces of the 15%–25%, 25%–35%, and 35%–45% sucrose solutions, respectively; LP2, crude synaptic vesicle fraction; LS1, supernatant above LP1; LS2, supernatant above LP2; P1, nuclei and cell debris; P2, crude synaptosomal fraction; P3, light membrane fraction; PSD, postsynaptic density fraction. S1, supernatant above P1; S2, supernatant above P2; S3, cytosolic fraction; Equal amounts of protein from cellular fractions were loaded, except for lane PSD, where 4 μg of protein was loaded. (B–D) Confocal micrographs of immunostained wild-type or Neto1-null (tlz/tlz) hippocampus. Scale bar, 5 μm. (E) Immunoblots of immunoprecipitates from wild-type (+/+) and Neto1-null crude synaptosomes. As a negative control, anti-hemagglutinin antibody (HA) did not immunoprecipitate either Neto1 or PSD-95. Note that the protein detected by anti-Neto1 antibody was not observed in crude synaptosomes or immunoprecipitates from Neto1-null mice, demonstrating the specificity of the anti-Neto1 antibody. For blots probed with Neto1 antibody, the exposure time for lanes 1–4 was ∼ten times more than for lanes 5 and 6. Blot, antibodies used for immunoblot analysis; IP, antibodies used for immunoprecipitation; Input, crude synaptosomal protein. (F) Immunoblot of immunoprecipitates from transfected HEK293 cell lysates. The identities of the transfected cDNAs are indicated above each lane. Neto1 and PSD-95 are full-length proteins. The Neto1-ΔTRV protein lacks the C-terminal PDZ ligand tripeptide TRV; Neto1-Δ20HA is a deletion construct in which the C-terminal 20 amino acid residues are replaced by two copies of the HA epitope tag; PDZ1–3 is a truncated PSD-95 protein composed of only the PDZ1, 2, and 3 domains. Similar results were observed in each of three experiments.
Figure 3
Figure 3. Neto1 Associates with NMDARs In Vivo
(A–C) Immunoblots of immunoprecipitates from adult wild-type (+/+) and Neto1-null (tlz/tlz) crude synaptosomes. IgG, immunoglobulin. For blots probed with Neto1 antibody in (A), the exposure time for lanes 1–4 was ∼ten times less than for lanes 5 and 6. Blot, antibody used for immunoblot analysis; IP, antibody used for immunoprecipitation. Similar results were observed in each of three experiments.
Figure 4
Figure 4. Neto1 Binds to NMDA Receptors Independently of the C-Terminal PDZ Ligand
(A, B) Immunoblots of immunoprecipitates from transfected HEK293 cell lysates. The transfected cDNAs are shown above each lane. CSF-1 EC-eGFP encodes the extracellular domain of CSF-1 fused to eGFP. Nrpn1 CUB12-eGFP encodes the two CUB domains from neuropilin-1 fused to eGFP. Blot, antibody used for immunoblot analysis; IP, antibody used for immunoprecipitation.
Figure 5
Figure 5. Neto1 Binds to NR2, but Not to NR1 Subunits
(A–D) Immunoblots of immunoprecipitations from transfected HEK293 cell lysates. The identities of the transfected cDNAs are shown above each lane. Blot, antibodies used for immunoblot analysis; IP, antibodies used for immunoprecipitation. Plexin-A2 and neuropilin-1 were used as a positive control for co-immunoprecipitation [74]. Similar results were observed in each of three experiments.
Figure 6
Figure 6. Neto1-Null Mice Have Normal Hippocampal Morphology and Express Normal Levels of Synaptic Proteins in Whole Brain
(A) Upper: A portion of the Neto1 gene showing exons (Ex). Top, encoded motifs. SS, signal sequence; open box, noncoding sequences; solid boxes, coding sequences. P, PstI restriction enzyme site. Middle: Neto1 targeting construct. tau-lacZ is a reporter gene encoding a tau-β-galactosidase fusion protein. tk, thymidine kinase negative selection cassette. Lower: Targeted Neto1tlz/tlz allele after homologous recombination. Arrows indicate direction of transcription. The 3′ external probe is shown by a black rectangle. (B) Genomic Southern blot from ES cell clones digested with PstI and hybridized with the 3′ probe. (C) Immunoblot of brain lysates from Neto1+/+, Neto1 +/tlz, and Neto1-null mice using anti-Neto1 antibodies raised to the C-terminal 86 amino acids of Neto1. The arrowhead indicates the specific Neto1 immunoreactive band of ∼66 kDa. This band corresponds to glycosylated Neto1 (unpublished data). (D, E) Nissl staining of hippocampus. Scale bar, 500 μm. (F, G) Confocal micrographs of wild-type or Neto1-null (tlz/tlz) hippocampal slices from CA1 showing normal MAP2 and NeuN immunostaining. (H, I) Golgi staining of hippocampus. (J, K) Enlarged area of hippocampus showing Golgi-stained CA1 pyramidal neurons. (L, M) Immunoblots of different synaptic proteins from (L) whole brain and (M) crude synaptosomes. (N) Co-immunoprecipitation and immunoblotting of NMDA receptors from crude synaptosomes. Antibodies used are indicated on the left. HA; anti-hemagglutinin negative control antibody.
Figure 7
Figure 7. Neto1 Loss of Function Decreases tbLTP in CA1 Hippocampus
(A) fEPSP slope and (B) fiber volley amplitude plotted as a function of stimulus intensity in Neto1+/+ (+/+, open circles) and Neto1-null (tlz/tlz, filled circles) mice. Strength of Schaffer collateral stimulation is indicated on the horizontal axis. Representative traces show fiber volley and fEPSPs (scale bars: 2 ms, 1.5 mV). (C) Paired-pulse facilitation of fEPSPs in slices from +/+ and tlz/tlz mice. Interstimulus interval is indicated on the horizontal axis. P1, fEPSP slope first response; P2, fEPSP slope second response. (D) Summary scatter plot shows grouped normalized fEPSP slope every 1 min in slices from +/+ (n = 20 slices) and tlz/tlz (n = 17 slices; **, p < 0.01; ***, p < 0.001 versus +/+) mice. Theta-burst stimulation (TBS) was delivered to Schaffer collateral CA1 synapses at the 30-min time point. fEPSP slope was normalized to the mean slope of fEPSPs recorded during the 10-min period immediately before TBS. Inset: average of six consecutive fEPSPs recorded at the times indicated before or after theta-burst stimulation (a or b, respectively; scale bars: 15 ms, 0.4 mV). Error bars show ± standard error of the mean (SEM).
Figure 8
Figure 8. Reduction of Basal NMDAR EPSC Amplitude at Schaffer Collateral-CA1 Synapses of Neto1-Null Mice
(A) Representative traces of AMPAR and NMDAR EPSCs from an individual +/+ (left) or tlz/tlz (right) neuron. The bottom trace in each was recorded at a holding potential of −70 mV (V m = −70 mV) then CNQX (10 μM) was bath applied and the top traces recorded at a holding potential of +60 mV (V m = +60 mV). Each trace is an average of six consecutive responses. For all traces the intensity of the Schaffer collateral was 10 V. INMDAR/IAMPAR was 0.31 for the +/+ neuron and 0.12 for the tlz/tlz neuron (scale bar: 80 ms, 100 pA). (B) Left: the plot shows INMDAR/IAMPAR as a function of AMPAR EPSC amplitude in +/+ (open circles) and tlz/tlz (filled circles) neurons. The range of synaptic activation was generated by an ascending series of stimulus intensities with the neuron at V m = −70 mV and then at V m = +60 mV + CNQX (10 μM) for each neuron tested with INMDAR/IAMPAR calculated for each corresponding stimulus. The data are plotted in 200 pA bins of AMPAR EPSC amplitude. The dotted line shows the overall mean of the INMDAR/IAMPAR for all data points across the amplitude range. Right: For each neuron, the average INMDAR/IAMPAR was calculated and the histogram shows the mean of INMDAR/IAMPAR for tlz/tlz (filled bar) or +/+ (open bar) neurons (**, p < 0.01). (C) Current-voltage (I-V) graph for pharmacologically isolated NMDARs from +/+ (open circles) and tlz/tlz (filled circles) mice. Right: superimposed NMDAR EPSC traces at V m from −100 to +80 mV in steps of 20 mV (scale bars: 150 ms/ 125 pA). (D) Current-voltage (I-V) graph for AMPAR EPSCs from Neto1+/+ (open circles) and Neto1-null mice (filled circles). Right: superimposed AMPAR EPSC traces (scale bars: 200 ms/ 200 pA). Error bars show ± standard error of the mean (SEM).
Figure 9
Figure 9. Reduction of NR2A in CA1 and tbLTP Subunit Dependency Switch from NR2A- to NR2B-NMDARs
(A) Immunoblots of synaptic proteins in whole hippocampal homogenates (10 μg of protein) and the hippocampal PSD fraction (2 μg of protein) from +/+ and tlz/tlz mice. Antibodies used for detection are indicated at left. Blots shown are representative of four separate experiments. (B) Histogram showing normalized levels of different synaptic proteins in tlz/tlz hippocampal homogenate relative to that of +/+ (white bars), and tlz/tlz PSD fractions relative to that of +/+ (black bars). Band intensity was quantified as a mean grayscale value. **, p < 0.01, t-test, n = 4 pools of five pairs of hippocampi. (C) Confocal micrographs of immunostained hippocampal slices from the CA1 region. Antibodies used are indicated in each box. Scale bar, 10 μm. Pyr, pyramidal cell layer; SR; stratum radiatum. (D) Histogram of relative number of NR2A, NR2B, and PSD-95 puncta in CA1 stratum radiatum between wild-type and Neto1-null (tlz/tlz) hippocampal slices. ***, p < 0.005, Student's t-test; n = 3 mice/genotype. (E) Histogram of pharmacologically isolated NMDAR EPSCs from CA1 neurons in hippocampal slices from +/+ (n = 5 neurons) and tlz/tlz (n = 6 neurons) mice before (−) and 40 min after Ro25–6981 (Ro; 2 μM). NMDAR EPSCs were monitored every 10 s throughout the experiment; the effect of Ro25–6981 had stabilized by 30 min of application. Results are expressed as a percentage of NMDAR amplitude, with the amplitude in +/+ (white bar) and tlz/tlz (filled bar) slices before Ro25–6981 treatment normalized to 100%. *, p < 0.05 versus Neto1+/+ (+/+) before Ro25–6981 treatment (−). ***, p < 0.001 versus tlz/tlz before Ro25–6981 treatment (−). (F) Summary scatter plot shows the grouped normalized fEPSP slope plotted every 1 min in Ro25–6981-treated slices (in ACSF beginning 30–40 min before theta-burst stimulation with a final concentration of 2 μM) from +/+ (n = 16 slices) and tlz/tlz (n = 9 slices) mice. Inset: average of six consecutive fEPSPs recorded at the times indicated (a or b; scale bars: 10 ms, 0.5 mV). (G) Histogram showing the theta-burst stimulation-induced increase in fEPSP slope 90 min after theta-burst stimulation in slices from +/+ and tlz/tlz mice without (−) and with Ro25–6981 (Ro) treatment. Results are expressed as a percentage of theta-burst stimulation-induced increase in fEPSP slope (% tbLTP) with tbLTP in +/+ and tlz/tlz slices without Ro25–6981 treatment normalized to 100% (white and filled bars, respectively). ***, p < 0.001 versus tlz/tlz without Ro25–6981 treatment (−). Data are shown as mean ± standard error of the mean (SEM).
Figure 10
Figure 10. Neto1-Null Mice Have Impaired Spatial Learning and Memory
(A) Latency to find the platform of wild-type (n = 9) and Neto1-null mice (n = 9) in the Morris water maze task at each day of training. During pretraining, escape latency to find a visible-cued (V) platform located in the northeast (NE) quadrant was unaffected by genotype. Similarly, in the acquisition phase (days 1–6), escape latency to find a hidden platform located in the southeast (SE) quadrant was unaffected by genotype. In the second acquisition phase (days 7–9), Neto1-null mice had longer escape latencies when the hidden platform was relocated to the northwest (NW) quadrant (effect of genotype: F 1,16= 5.50, p < 0.05; genotype × day interaction: F 2,32 = 4.17, p < 0.05). (B) Histogram of percent time spent in each quadrant after the first acquisition phase. T, target quadrant. (C) Histogram of percent time spent in each quadrant after the second acquisition phase. Neto1-null mice spent significantly less time in the new target quadrant (NW) than wild-type littermates (effect of genotype: F 1,16 = 9.75, p < 0.01). Data are shown as mean ± standard error of the mean (SEM).
Figure 11
Figure 11. Neto1-Null Mice Are Impaired in Rapid Spatial Learning
In the delayed matching-to-place (DMP) version of the Morris water maze task, wild-type and Neto1-null mice were trained each day to navigate to a new hidden platform placed in one of 12 assigned locations. (A, B) Latency to find novel platform locations during the first 8 d of training. (A) Training block 1 (days 1–4): escape latency for each trial averaged across 4 d. (B) Training block 2 (days 5–8): escape latency for each trial averaged across 4 d. (C) Latency to find novel platform locations during the last 4 d of the 12-d training period. Neto1-null mice had longer escape latencies than Neto1+/+ mice (F 1,64 = 9.03, p < 0.01) during days 9–12. For each of the six trials conducted each day, the escape latencies were averaged over multiple subjects for each genotype. **, p < 0.01. (D) Response to spatial novelty in wild-type (n = 12) and Neto1-null mice (n = 12). Analysis of the time spent in contact with DOs and NDOs revealed a significant effect of object rearrangement (F 1,22 = 17.2, p < 0.001), genotype effect on time spent on DO versus NDO objects (F 1,22 = 3.5, p < 0.05), as well as their interactions (F 1,22 = 35.9, p < 0.001). Wild-type mice spent significantly more time examining the DO versus the NDO (F 1, 11 = 78.6, p < 0.001), whereas Neto1-null mice spent the same time examining both the DO and the NDO (F 1,11 = 1.2, p > 0.05). All mice had a similar latency to find the DO (wild-type: 35.3 s ± 5.7 s; Neto1-null: 31.2 s ± 12.7 s), therefore, excluding a possible influence of anxiety in response to the spatial changes and reaction to the DO. (E) Response to object replacement. Neto1-null mice were not impaired in novel object recognition. ANOVA revealed a significant effect of object novelty (F 1,22 = 67.6, p < 0.001), no main effect of genotype on time spent on familiar object (FO) versus novel object (NO) (F 1,22 = 0.04, p > 0.05) or their interactions (F 1,21 = 0.04, p > 0.05). Wild-type (F 1,11 = 54.0, p < 0.001, n = 12) and Neto1-null (F 1,11 = 24.4, p < 0.001, n = 12) expressed marked interest to the NO versus FO. **, p < 0.01 in comparison with familiar object. All genotypes had the same latency to find the novel object (wild-type: 115.4 s ± 14.2 s; Neto1-null: 103.4 s ± 7.8 s). Error bars represent ± standard error of the mean (SEM).
Figure 12
Figure 12. The Ampakine CX546 Restores the tbLTP Deficit in Neto1-Null Mice and Increases AMPAR, but Not NMDAR, EPSC Amplitude at Schaffer Collateral-CA1 Synapses
(A) Scatter plots of normalized fEPSP slope plotted every 1 min from two individual representative Neto1-null slices without (white circle) or with (gray circle) CX546 (25 μm). When present, CX546 was applied to ACSF beginning 20–30 min before theta-burst stimulation. Theta-burst stimulation (TBS) was delivered to Schaffer collateral-CA1 synapses at the 30-min time point. The fEPSP slope was normalized with respect to the mean slope of fEPSPs recorded during the 10-min period immediately before theta-burst stimulation. Inset: average of six consecutive fEPSPs recorded at the times indicated (a or b; scale bars: 10 ms, 0.5 mV). (B) Histogram showing theta-burst stimulation-induced increase in fEPSP slope 90 min after theta-burst stimulation in slices from Neto1-null mice (tlz/tlz) without CX546 (-, white bar; n = 17 slices) and with CX546 (filled bar; n = 9 slices) and in Neto1+/+ mice without CX546 (-, filled hatched bar; n = 20 slices) and with CX546 (white hatched bar; n = 7 slices). Results are expressed as a percentage of normalized slope fEPSP. **, p < 0.01 versus tlz/tlz with CX546 (filled bar). (C) Representative traces show AMPAR EPSCs (held at −70 mV) before (black traces) and 20 min after CX546 (25 μM; gray traces) administration in hippocampal slices from Neto1+/+ (+/+) and Neto1-null (tlz/tlz) mice. Each EPSC is the average of six consecutive traces. Scale bars: 20 ms, 200 pA. (D) Representative traces show NMDAR EPSCs (+60 mV) before (black traces) and 20–30 min after CX546 (25 μM; gray traces) administration in hippocampal slices from Neto1+/+ (+/+) and Neto1-null (tlz/tlz) mice. Each EPSC is the average of six consecutive traces. Scale bars: +/+, 100 ms, 75 pA; tlz/tlz, 100 ms, 35 pA. Below: Histogram of pharmacologically isolated NMDAR EPSC amplitude (left) or decay (right) from CA1 neurons in hippocampal slices from +/+ (n = 8 neurons) and tlz/tlz (n = 6 neurons) mice 20–30 min after CX546 administration (25 μM; filled bars). Results are expressed as a percentage of NMDAR EPSC amplitude or decay with the amplitude or decay in +/+ and tlz/tlz slices before CX546 treatment normalized to 100% (dotted line). (E) Top: superimposed NMDAR EPSC traces at V m from −100 to +80 mV in steps of 20 mV (scale bars: 100 ms, 70 pA) from a tlz/tlz hippocampal CA1 neuron before (black traces) and 20 min after CX546 administration (gray traces). Bottom: Summary scatter plot shows current-voltage (I-V) relationship for pharmacologically isolated NMDARs before (black circles) and after CX546 administration (gray circles) from five tlz/tlz hippocampal CA1 neurons. Error bars represent ± standard error of the mean (SEM).
Figure 13
Figure 13. Spatial Learning Impairments in Neto1-Null Mice Are Rescued by CX546
(A) Latency to find the platform of wild-type and Neto1-null mice at each day of training in the Morris water maze task. Mice were administered either vehicle (25% cyclodextran) or 15 mg/kg CX546. During pretraining, escape latency to a visible-cued (V) platform located in the northeast (NE) quadrant was unaffected by genotype (unpublished data). In the acquisition phase (days 1–6), escape latency to find a hidden platform located in the southeast (SE) quadrant was also unaffected by genotype (F 1,10 = 0.544, p > 0.05). In the second acquisition phase (days 7–9), Neto1-null mice treated with vehicle had longer escape latencies compared with Neto1-null mice treated with CX546, as well as wild-type mice treated with the vehicle control or CX546 when the hidden platform was relocated to the northwest (NW) quadrant (three-way ANOVA, genotype effect, F 1,20 = 8.28, p < 0.01). In contrast, Neto1-null mice treated with CX546 had escape latencies identical to wild-type mice treated with the vehicle or CX546 (one-way ANOVA, F 1,15 = 0.45; p = 0.7). There was no difference in escape latency between Neto1-null and wild-type mice treated with CX546 (F 1,10 = 0.977, p > 0.05). (B) Histogram of percent time spent in each quadrant after the first acquisition phase. There were no differences between groups (one-way ANOVA, F 1,10 = 0.96, p > 0.3). (C) Histogram of percent time spent in each quadrant after the second acquisition phase. Neto1-null mice treated with CX546 spent the same amount of time in the new target quadrant as wild-type mice treated with vehicle control or CX546. In contrast, Neto1-null mice given vehicle control did not show a preference for the new target quadrant. (D) Histogram summarizing the rescue effect of CX546 on Neto1-null mice in the spatial novelty behavioural task. Neto1-null mice treated with vehicle (n = 8) were impaired in spatial learning (F 1,14 = 2.6, p < 0.05). Neto1-null mice administered CX546 (n = 7) were indistinguishable from spatial object recognition of wild-type controls and were able to discriminate DO versus NDO (F 1,12 = 53.4, p < 0.001). Wild-type vehicle controls (n = 8) did not differ from wild-type mice given CX546 (n = 8) in response to spatial rearrangements (F 1,14 = 3.5, p > 0.05). Error bars represent ± standard error of the mean (SEM).
Figure 14
Figure 14. Proposed Model by Which CX546 Rescues Impaired LTP at Neto1-Null Schaffer Collateral-CA1 Synapses
(A) Left: At wild-type synapses, during basal synaptic transmission, glutamate release activates AMPA receptors, causing a depolarization of the synaptic membrane. Right: During LTP induction, membrane depolarization provides a temporary relief of the magnesium ion blockade of NMDARs (primarily NR2A-NMDARs), allowing sodium and calcium ions to enter through the receptor, which triggers events leading to LTP. (B) Left: At Neto1-null Schaffer collateral-CA1 synapses, basal synaptic transmission through AMPA receptors is unperturbed. Right: During LTP induction, in the absence of Neto1, current through NMDARs (primarily mediated by NR2B-containing NMDARs) is significantly reduced, leading to a reduction in NMDA receptor signaling and impairment in LTP. (C) Left: Binding of CX546 to AMPA receptors alters the receptor desensitization kinetics and prolongs membrane depolarization, allowing more influx of sodium ions. Right: During LTP induction, at a concentration of CX546 sufficient to restore the LTP deficit in Neto1-null Schaffer collateral-CA1 synapses, prolonged membrane depolarization extends the temporary relief of the magnesium ion blockade, increasing the sodium and calcium ion influx through NMDARs to levels sufficient to restore LTP to wild-type levels.

References

    1. Dingledine R, Borges K, Bowie D, Traynelis SF. The glutamate receptor ion channels. Pharmacol Rev. 1999;51:7–61. - PubMed
    1. Malenka RC, Bear MF. LTP and LTD: an embarrassment of riches. Neuron. 2004;44:5–21. - PubMed
    1. Tsien JZ. Linking Hebb's coincidence-detection to memory formation. Curr Opin Neurobiol. 2000;10:266–273. - PubMed
    1. Husi H, Ward MA, Choudhary JS, Blackstock WP, Grant SG. Proteomic analysis of NMDA receptor-adhesion protein signaling complexes. Nat Neurosci. 2000;3:661–669. - PubMed
    1. Grant SG, Blackstock WP. Proteomics in neuroscience: from protein to network. J Neurosci. 2001;21:8315–8318. - PMC - PubMed

Publication types

MeSH terms