

Tumor markers of bladder cancer: the schistosomal bladder tumors versus non-schistosomal bladder tumors
- PMID: 19243595
- PMCID: PMC2650688
- DOI: 10.1186/1756-9966-28-27
Tumor markers of bladder cancer: the schistosomal bladder tumors versus non-schistosomal bladder tumors
Abstract
Background: The aim of this study is to comparatively elucidate the underlying molecular pathways and clinicopathological criteria in schistosomal bladder tumor (SBT) versus non-schistosomal bladder tumor (NSBT).
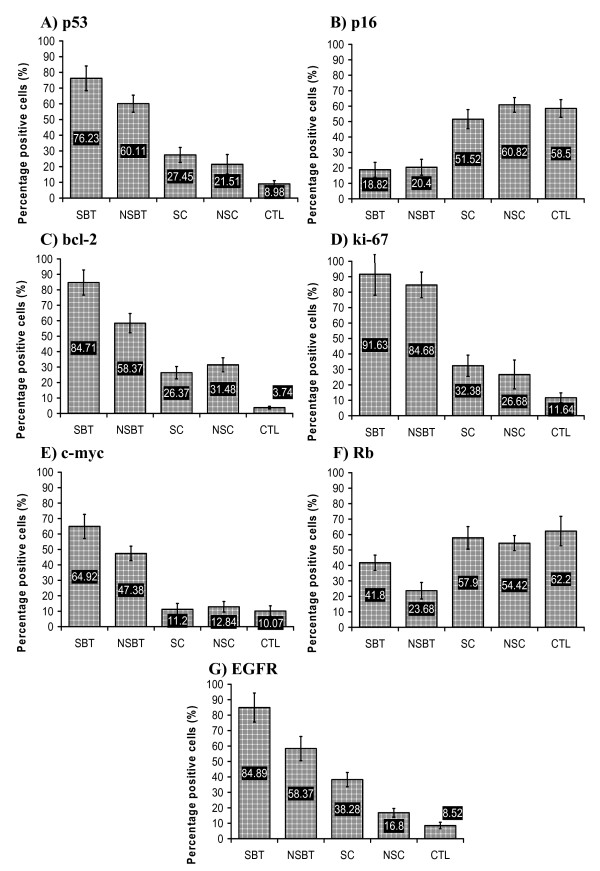
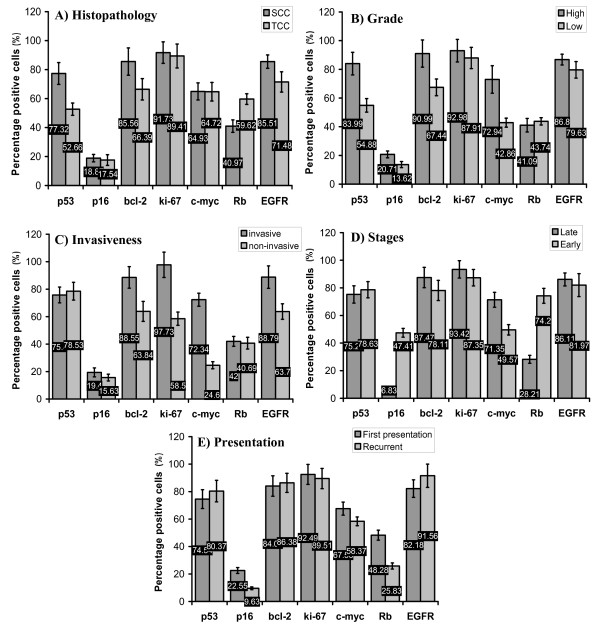
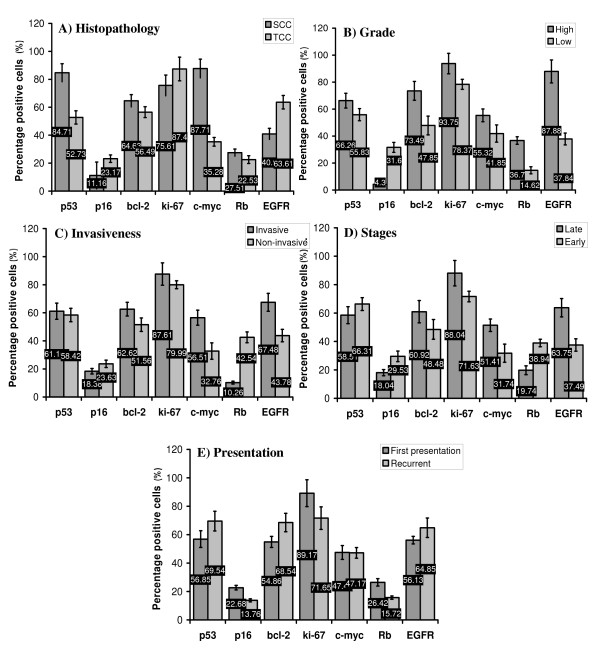
Methods: This study explored the role of p53, p16, bcl-2, ki-67, c-myc, Rb and EGFR, by using Immunohistochemistry assay, in 45 SBT and 39 NSBT patients in comparison with 16 schistosomal chronic cystitis (SC), 28 non-schistosomal chronic cystitis (NSC), and 20 normal control (CTL) subjects. The studied markers in SBT and NSBT were correlated with different clinicopathological criteria namely, tumor histopathology, grading, invasiveness, stage, and presentation of the disease.
Results: SBT was associated with high grade invasive squamous cell carcinoma (SCC) while NSBT was associated with lower grade less invasive transitional cell carcinoma (TCC). The expression of p53, bcl-2, c-myc, and EGFR was higher in SBT than in NSBT while Rb was higher in NSBT than in SBT. However, p16 and ki-67 were not different between SBT and NSBT. The profile of molecular markers in SC was similar to NSC except for EGFR which was higher in SC than in NSC. Both SC and NSC showed higher level of p53, bcl-2, ki-67, and EGFR than in CTL group while p16, Rb, and c-myc were not different. p53 was associated with high grade SCC in both SBT and NSBT. Bcl-2 was associated with high grade invasive tumors in SBT and NSBT. P16 was associated with low grade, late stage, and recurrent SBT and high grade, invasive, late stage, and recurrent NSBT. Rb was associated with SCC in SBT, invasive tumors in NSBT, and late stage and recurrent presentation in both SBT and NSBT. C-myc was associated with high grade, invasive, and late stage SBT and SCC, high grade, invasive, and late stage NSBT. EGFR was associated with invasive SCC in SBT and invasive, high grade, and late stage TCC in NSBT. ki-67 was associated with invasive SBT and high grade late stage NSBT.
Conclusion: SBT and NSBT showed distinct molecular profile of tumor development and progression which can be taken into consideration in fine adjusting the anti-cancer therapy for SBT and NSBT.
Figures

Similar articles
-
Expression of bcl-2 and p53 oncoproteins in schistosomiasis-associated transitional and squamous cell carcinoma of urinary bladder.Br J Urol. 1997 Jan;79(1):78-84. doi: 10.1046/j.1464-410x.1997.30717.x. Br J Urol. 1997. PMID: 9043502
-
Muscle invasive schistosomal squamous cell carcinoma of the urinary bladder: frequency and prognostic significance of p53, BCL-2, HER2/neu, and proliferation (MIB-1).Hum Pathol. 2004 Feb;35(2):184-9. doi: 10.1016/j.humpath.2003.10.006. Hum Pathol. 2004. PMID: 14991535
-
DNA copy number changes in Schistosoma-associated and non-Schistosoma-associated bladder cancer.Am J Pathol. 2000 Mar;156(3):871-8. doi: 10.1016/S0002-9440(10)64956-5. Am J Pathol. 2000. PMID: 10702404 Free PMC article.
-
Targeting molecular signaling pathways of Schistosoma haemotobium infection in bladder cancer.Virulence. 2011 Jul-Aug;2(4):267-79. doi: 10.4161/viru.2.4.16734. Epub 2011 Jul 1. Virulence. 2011. PMID: 21788729 Review.
-
[Anatomopathological aspects of 25 cases of bilharzial bladder cancer].Bull Soc Pathol Exot. 1996;89(3):181-4. Bull Soc Pathol Exot. 1996. PMID: 8998411 Review. French.
Cited by
-
Immunohistochemical expression of COX2 and iNOS in bladder cancer and its association with urinary schistosomiasis among Sudanese patients.Infect Agent Cancer. 2013 Feb 15;8(1):9. doi: 10.1186/1750-9378-8-9. Infect Agent Cancer. 2013. PMID: 23414519 Free PMC article.
-
Development of Urinary Bladder Pre-Neoplasia by Schistosoma haematobium Eggs and Chemical Carcinogen in Mice.Korean J Parasitol. 2017 Feb;55(1):21-29. doi: 10.3347/kjp.2017.55.1.21. Epub 2017 Feb 28. Korean J Parasitol. 2017. PMID: 28285503 Free PMC article.
-
[Squamous cell lesions of the urinary bladder].Urologe A. 2014 Mar;53(3):368, 370-4. doi: 10.1007/s00120-013-3406-z. Urologe A. 2014. PMID: 24549798 Review. German.
-
Levels of certain tumor markers as differential factors between bilharzial and non-biharzial bladder cancer among Egyptian patients.Cancer Cell Int. 2011 Apr 7;11(1):8. doi: 10.1186/1475-2867-11-8. Cancer Cell Int. 2011. PMID: 21473769 Free PMC article.
-
Cyclooxygenase-2 and B-cell lymphoma-2 expression in cystitis glandularis and primary vesicle adenocarcinoma.BMC Urol. 2014 Jan 3;14:2. doi: 10.1186/1471-2490-14-2. BMC Urol. 2014. PMID: 24387269 Free PMC article.
References
-
- Shirai T. Etiology of bladder cancer. Semin Urol. 1993;3:113–116. - PubMed
-
- Carroll PR. Urothelial Carcinoma: Cancers of the Bladder Ureter & Renal Pelvis. In: Tanagho EA, McAninch JW, editor. General Urology. 14. Philadelphia: Prentice-Hall International Inc; 1995. pp. 353–372.
-
- Sandberg AA, Berger CS. Review of chromosome studies in urological tumors. II. Cytogenetics and molecular genetics of bladder cancer. J Urol. 1994;151:545–560. - PubMed
-
- Ejezie GC. The epidemiology and control of schistosomiasis in Africa. Nigeria J Med. 1991;1:29–30.
-
- El-Harvey MA, Amr MM, Abdel-Rahman AB. The epidemiology of schistosomiasis in Egypt: Gharbia Governorate. Am J Trop Med Hyg. 2000;62:42–48. - PubMed
Publication types
MeSH terms
Substances
LinkOut - more resources
Full Text Sources
Medical
Research Materials
Miscellaneous
