. 2009 Mar;250(3):803-12.
doi: 10.1148/radiol.2503080473.

Correlation of MR imaging and MR spectroscopic imaging findings with Ki-67, phospho-Akt, and androgen receptor expression in prostate cancer

Affiliations

Correlation of MR imaging and MR spectroscopic imaging findings with Ki-67, phospho-Akt, and androgen receptor expression in prostate cancer

Amita Shukla-Dave et al. Radiology. 2009 Mar.

Abstract

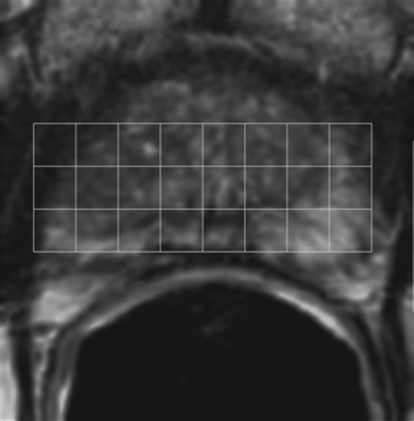
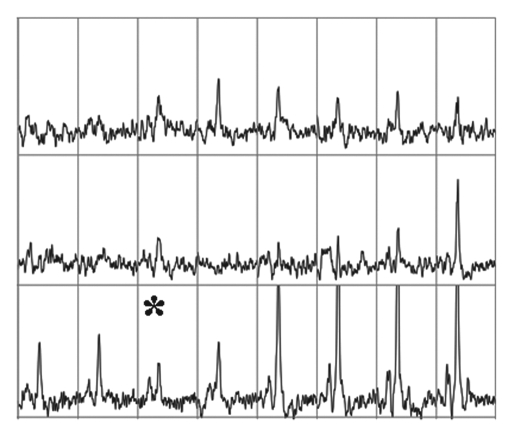
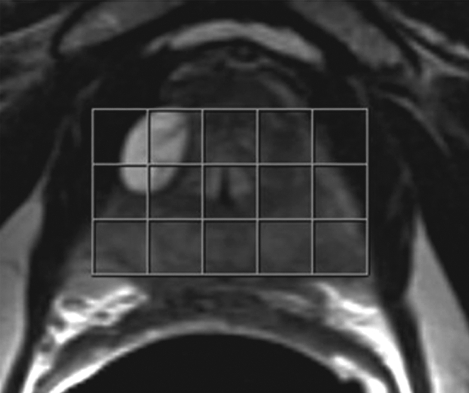
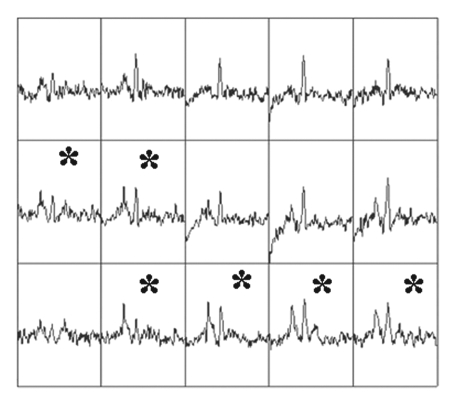
Purpose: To retrospectively assess whether magnetic resonance (MR) imaging and MR spectroscopic imaging and selected molecular markers correlate with each other and with clinically insignificant and significant prostate cancer (PCa), as defined at surgical pathologic analysis.

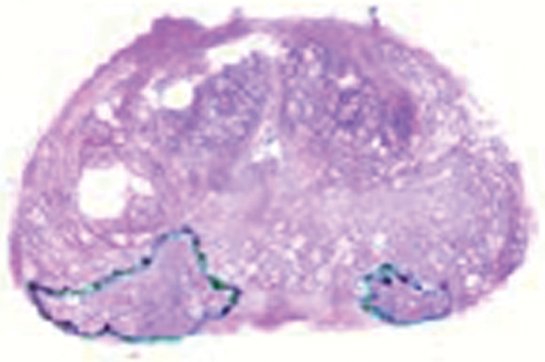
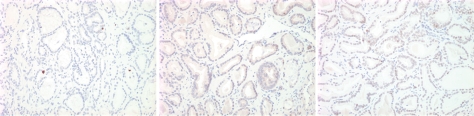
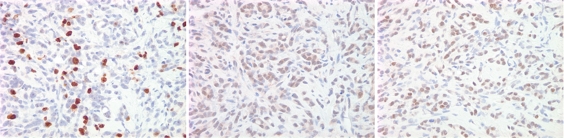
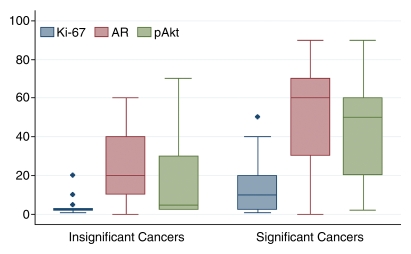
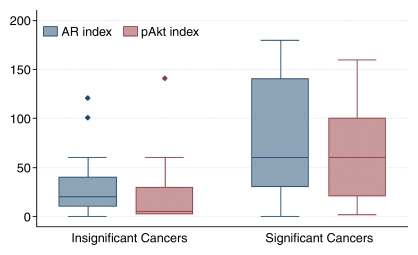
Materials and methods: The institutional review board approved this HIPAA-compliant study and waived informed consent. Eighty-nine men (mean age, 63 years; range, 46-79 years) with biopsy-proved PCa underwent combined endorectal MR imaging and MR spectroscopic imaging before radical prostatectomy. Suspicion of clinically insignificant PCa was retrospectively and separately recorded for MR imaging and combined MR imaging and MR spectroscopic imaging by using a scale of 0-3. Clinically insignificant PCa was pathologically defined as organ-confined cancer of 0.5 cm(3) or less without poorly differentiated elements. Prostatectomy specimens underwent immunohistochemical analysis for three molecular markers: Ki-67, phospho-Akt (pAkt), and androgen receptor (AR). To examine differences in marker levels for clinically insignificant and significant cancer, a Wilcoxon rank sum test was used. To examine correlations between marker levels and MR imaging or combined MR imaging and MR spectroscopic imaging scores, the Spearman correlation was used.

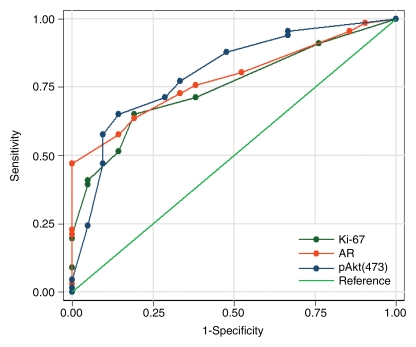
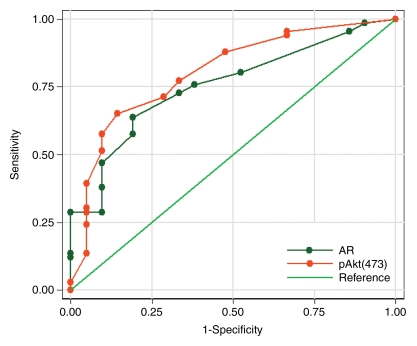
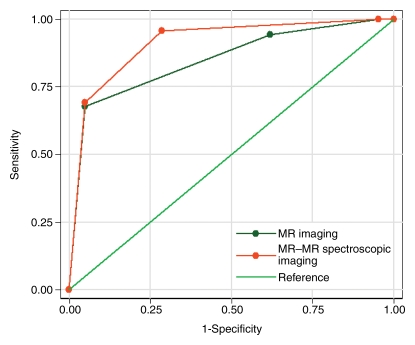
Results: Twenty-one (24%) patients had clinically insignificant and 68 (76%) had clinically significant PCa at surgical pathologic review. All markers were significantly correlated with MR imaging and combined MR imaging and MR spectroscopic imaging findings (all correlation coefficients >0.5). In differentiating clinically insignificant from clinically significant PCa, areas under the receiver operating characteristic curves for Ki-67, AR, pAkt, MR imaging, and combined MR imaging and MR spectroscopic imaging were 0.75, 0.78, 0.80, 0.85, and 0.91, respectively.

Conclusion: The use of pretreatment MR imaging or combined MR imaging and MR spectroscopic imaging and molecular marker analyses of biopsy samples could facilitate better treatment selection.

Supplemental material: http://radiology.rsnajnls.org/cgi/content/full/250/3/803/DC1.


Figures

Figure 1a:
Figure 1a:
Imaging and pathologic data for 67-year-old patient with PSA level, 9.4 ng/mL (9.4 μg/mL); PCa stage, T2a; and biopsy Gleason score, 6; resulting in combined MR imaging and MR spectroscopic imaging score of 1 (probable insignificant cancer). (a) MR spectroscopic imaging (volume excitation with water and lipid suppression by means of spectral-spatial pulses; 1000/130; chemical shift imaging matrix, 16 × 8 × 8; field of view, 110 × 55 × 55 mm; spatial resolution, 6.9 mm; one signal acquired; and imaging time, 17 minutes) grid superimposed on transverse T2-weighted MR image (4000/102; echo train length, 12; field of view, 14 cm; acquisition matrix, 256 × 192; section thickness, 3 mm; no intersection gap; and four signals acquired). (b) Corresponding spectroscopic grid shows voxel (*) suspicious for cancer. (c) Histopathologic section shows Gleason score, 6 (solid line); total volume, 0.357 cm3 (clinically insignificant cancer). (d) IHC staining of prostatectomy specimens from tissue section shown in c for Ki-67 (left), pAkt (middle), and AR (right).
Figure 1b:
Figure 1b:
Imaging and pathologic data for 67-year-old patient with PSA level, 9.4 ng/mL (9.4 μg/mL); PCa stage, T2a; and biopsy Gleason score, 6; resulting in combined MR imaging and MR spectroscopic imaging score of 1 (probable insignificant cancer). (a) MR spectroscopic imaging (volume excitation with water and lipid suppression by means of spectral-spatial pulses; 1000/130; chemical shift imaging matrix, 16 × 8 × 8; field of view, 110 × 55 × 55 mm; spatial resolution, 6.9 mm; one signal acquired; and imaging time, 17 minutes) grid superimposed on transverse T2-weighted MR image (4000/102; echo train length, 12; field of view, 14 cm; acquisition matrix, 256 × 192; section thickness, 3 mm; no intersection gap; and four signals acquired). (b) Corresponding spectroscopic grid shows voxel (*) suspicious for cancer. (c) Histopathologic section shows Gleason score, 6 (solid line); total volume, 0.357 cm3 (clinically insignificant cancer). (d) IHC staining of prostatectomy specimens from tissue section shown in c for Ki-67 (left), pAkt (middle), and AR (right).
Figure 1c:
Figure 1c:
Imaging and pathologic data for 67-year-old patient with PSA level, 9.4 ng/mL (9.4 μg/mL); PCa stage, T2a; and biopsy Gleason score, 6; resulting in combined MR imaging and MR spectroscopic imaging score of 1 (probable insignificant cancer). (a) MR spectroscopic imaging (volume excitation with water and lipid suppression by means of spectral-spatial pulses; 1000/130; chemical shift imaging matrix, 16 × 8 × 8; field of view, 110 × 55 × 55 mm; spatial resolution, 6.9 mm; one signal acquired; and imaging time, 17 minutes) grid superimposed on transverse T2-weighted MR image (4000/102; echo train length, 12; field of view, 14 cm; acquisition matrix, 256 × 192; section thickness, 3 mm; no intersection gap; and four signals acquired). (b) Corresponding spectroscopic grid shows voxel (*) suspicious for cancer. (c) Histopathologic section shows Gleason score, 6 (solid line); total volume, 0.357 cm3 (clinically insignificant cancer). (d) IHC staining of prostatectomy specimens from tissue section shown in c for Ki-67 (left), pAkt (middle), and AR (right).
Figure 1d:
Figure 1d:
Imaging and pathologic data for 67-year-old patient with PSA level, 9.4 ng/mL (9.4 μg/mL); PCa stage, T2a; and biopsy Gleason score, 6; resulting in combined MR imaging and MR spectroscopic imaging score of 1 (probable insignificant cancer). (a) MR spectroscopic imaging (volume excitation with water and lipid suppression by means of spectral-spatial pulses; 1000/130; chemical shift imaging matrix, 16 × 8 × 8; field of view, 110 × 55 × 55 mm; spatial resolution, 6.9 mm; one signal acquired; and imaging time, 17 minutes) grid superimposed on transverse T2-weighted MR image (4000/102; echo train length, 12; field of view, 14 cm; acquisition matrix, 256 × 192; section thickness, 3 mm; no intersection gap; and four signals acquired). (b) Corresponding spectroscopic grid shows voxel (*) suspicious for cancer. (c) Histopathologic section shows Gleason score, 6 (solid line); total volume, 0.357 cm3 (clinically insignificant cancer). (d) IHC staining of prostatectomy specimens from tissue section shown in c for Ki-67 (left), pAkt (middle), and AR (right).
Figure 2a:
Figure 2a:
Imaging and pathologic data for 63-year-old patient with PSA level, 21.2 ng/mL (21.2 μg/mL); PCa stage, T2b; and biopsy Gleason score, 7; resulting in combined MR imaging and MR spectroscopic imaging score of 3 (definite clinically significant cancer). (a) MR spectroscopic imaging (volume excitation with water and lipid suppression by means of spectral-spatial pulses; 1000/130; chemical shift imaging matrix, 16 × 8 × 8; field of view, 110 × 55 × 55 mm; spatial resolution, 6.9 mm; one signal acquired; and imaging time, 17 minutes) grid superimposed on transverse T2-weighted MR image (4000/102; echo train length, 12; field of view, 14 cm; acquisition matrix, 256 × 192; section thickness, 3 mm; no intersection gap; and four signals acquired). (b) Corresponding spectroscopic grid shows voxels (*) suspicious for cancer. (c) Histopathologic section shows Gleason score, 7 (solid line); total volume, 8.892 cm3 (clinically significant cancer). (d) IHC staining of prostatectomy specimens from tissue section shown in c for Ki-67(left), pAkt (middle), and AR (right).
Figure 2b:
Figure 2b:
Imaging and pathologic data for 63-year-old patient with PSA level, 21.2 ng/mL (21.2 μg/mL); PCa stage, T2b; and biopsy Gleason score, 7; resulting in combined MR imaging and MR spectroscopic imaging score of 3 (definite clinically significant cancer). (a) MR spectroscopic imaging (volume excitation with water and lipid suppression by means of spectral-spatial pulses; 1000/130; chemical shift imaging matrix, 16 × 8 × 8; field of view, 110 × 55 × 55 mm; spatial resolution, 6.9 mm; one signal acquired; and imaging time, 17 minutes) grid superimposed on transverse T2-weighted MR image (4000/102; echo train length, 12; field of view, 14 cm; acquisition matrix, 256 × 192; section thickness, 3 mm; no intersection gap; and four signals acquired). (b) Corresponding spectroscopic grid shows voxels (*) suspicious for cancer. (c) Histopathologic section shows Gleason score, 7 (solid line); total volume, 8.892 cm3 (clinically significant cancer). (d) IHC staining of prostatectomy specimens from tissue section shown in c for Ki-67(left), pAkt (middle), and AR (right).
Figure 2c:
Figure 2c:
Imaging and pathologic data for 63-year-old patient with PSA level, 21.2 ng/mL (21.2 μg/mL); PCa stage, T2b; and biopsy Gleason score, 7; resulting in combined MR imaging and MR spectroscopic imaging score of 3 (definite clinically significant cancer). (a) MR spectroscopic imaging (volume excitation with water and lipid suppression by means of spectral-spatial pulses; 1000/130; chemical shift imaging matrix, 16 × 8 × 8; field of view, 110 × 55 × 55 mm; spatial resolution, 6.9 mm; one signal acquired; and imaging time, 17 minutes) grid superimposed on transverse T2-weighted MR image (4000/102; echo train length, 12; field of view, 14 cm; acquisition matrix, 256 × 192; section thickness, 3 mm; no intersection gap; and four signals acquired). (b) Corresponding spectroscopic grid shows voxels (*) suspicious for cancer. (c) Histopathologic section shows Gleason score, 7 (solid line); total volume, 8.892 cm3 (clinically significant cancer). (d) IHC staining of prostatectomy specimens from tissue section shown in c for Ki-67(left), pAkt (middle), and AR (right).
Figure 2d:
Figure 2d:
Imaging and pathologic data for 63-year-old patient with PSA level, 21.2 ng/mL (21.2 μg/mL); PCa stage, T2b; and biopsy Gleason score, 7; resulting in combined MR imaging and MR spectroscopic imaging score of 3 (definite clinically significant cancer). (a) MR spectroscopic imaging (volume excitation with water and lipid suppression by means of spectral-spatial pulses; 1000/130; chemical shift imaging matrix, 16 × 8 × 8; field of view, 110 × 55 × 55 mm; spatial resolution, 6.9 mm; one signal acquired; and imaging time, 17 minutes) grid superimposed on transverse T2-weighted MR image (4000/102; echo train length, 12; field of view, 14 cm; acquisition matrix, 256 × 192; section thickness, 3 mm; no intersection gap; and four signals acquired). (b) Corresponding spectroscopic grid shows voxels (*) suspicious for cancer. (c) Histopathologic section shows Gleason score, 7 (solid line); total volume, 8.892 cm3 (clinically significant cancer). (d) IHC staining of prostatectomy specimens from tissue section shown in c for Ki-67(left), pAkt (middle), and AR (right).
Figure 3a:
Figure 3a:
Box-and-whisker plots show median and range of molecular marker levels, expressed as (a) percentages or (b) indices, in clinically insignificant and significant cancer as defined at pathologic examination. Diamonds indicate outliers.
Figure 3b:
Figure 3b:
Box-and-whisker plots show median and range of molecular marker levels, expressed as (a) percentages or (b) indices, in clinically insignificant and significant cancer as defined at pathologic examination. Diamonds indicate outliers.
Figure 4a:
Figure 4a:
(a) Graph shows comparison of ROC curves for Ki-67, pAkt, and AR (expressed as percentages) in differentiating between clinically insignificant and significant PCas defined at pathologic examination; AUCs were 0.75, 0.80, and 0.78, respectively. (b) Graph shows comparison of ROC curves for pAkt and AR indices in differentiating between clinically insignificant and significant PCas defined at pathologic examination; AUCs were 0.80 and 0.76, respectively.
Figure 4b:
Figure 4b:
(a) Graph shows comparison of ROC curves for Ki-67, pAkt, and AR (expressed as percentages) in differentiating between clinically insignificant and significant PCas defined at pathologic examination; AUCs were 0.75, 0.80, and 0.78, respectively. (b) Graph shows comparison of ROC curves for pAkt and AR indices in differentiating between clinically insignificant and significant PCas defined at pathologic examination; AUCs were 0.80 and 0.76, respectively.
Figure 5:
Figure 5:
Graph shows comparison of ROC curves for MR imaging and combined MR imaging and MR spectroscopic imaging scores in differentiating between clinically insignificant and significant PCas defined at pathologic examination; AUC for MR imaging score was 0.85, AUC for combined MR imaging and MR spectroscopic imaging score was 0.91.

Similar articles

Cited by

References

    1. Klein EA. What is ‘insignificant’ prostate carcinoma? Cancer 2004;101:1923–1925. - PubMed
    1. Carter HB, Sauvageot J, Walsh PC, Epstein JI. Prospective evaluation of men with stage T1C adenocarcinoma of the prostate. J Urol 1997;157:2206–2209. - PMC - PubMed
    1. Epstein JI, Chan DW, Sokoll LJ, et al. Nonpalpable stage T1c prostate cancer: prediction of insignificant disease using free/total prostate specific antigen levels and needle biopsy findings. J Urol 1998;160:2407. - PubMed
    1. Epstein JI, Sanderson H, Carter HB, Scharfstein DO. Utility of saturation biopsy to predict insignificant cancer at radical prostatectomy. Urology 2005;66:356–360. - PubMed
    1. Epstein JI, Walsh PC, Carmichael M, Brendler CB. Pathologic and clinical findings to predict tumor extent of nonpalpable (stage T1c) prostate cancer. JAMA 1994;271:368–374. - PubMed

Publication types