

Immune effector cells produce lethal DNA damage in cells treated with a thiopurine
- PMID: 19244103
- PMCID: PMC2658672
- DOI: 10.1158/0008-5472.CAN-08-4264
Immune effector cells produce lethal DNA damage in cells treated with a thiopurine
Abstract
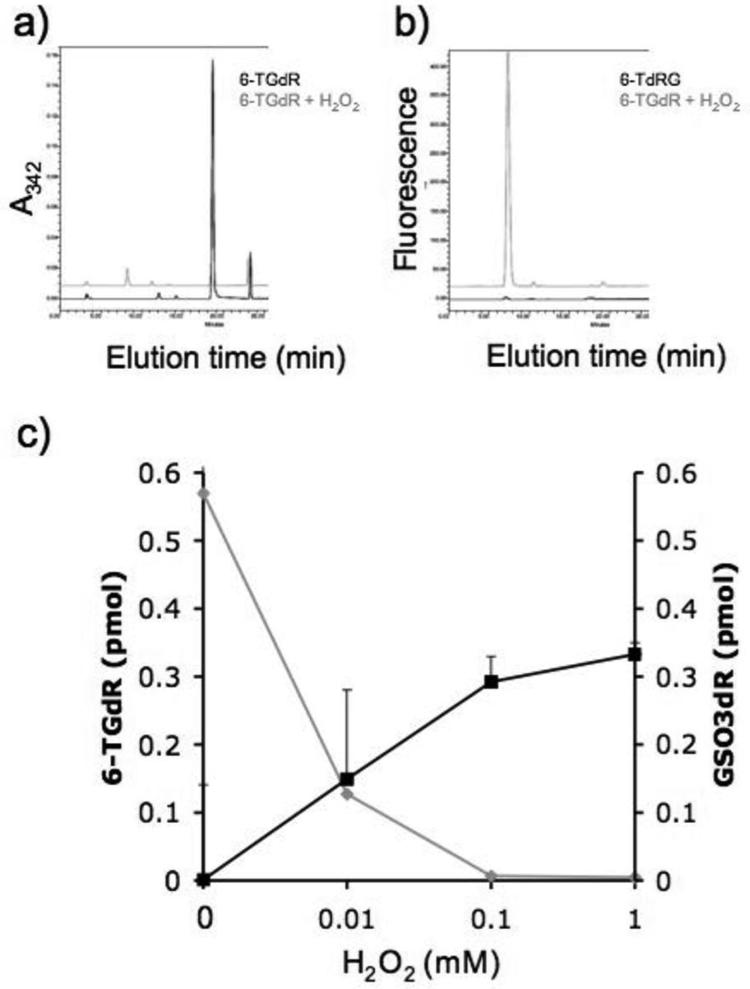
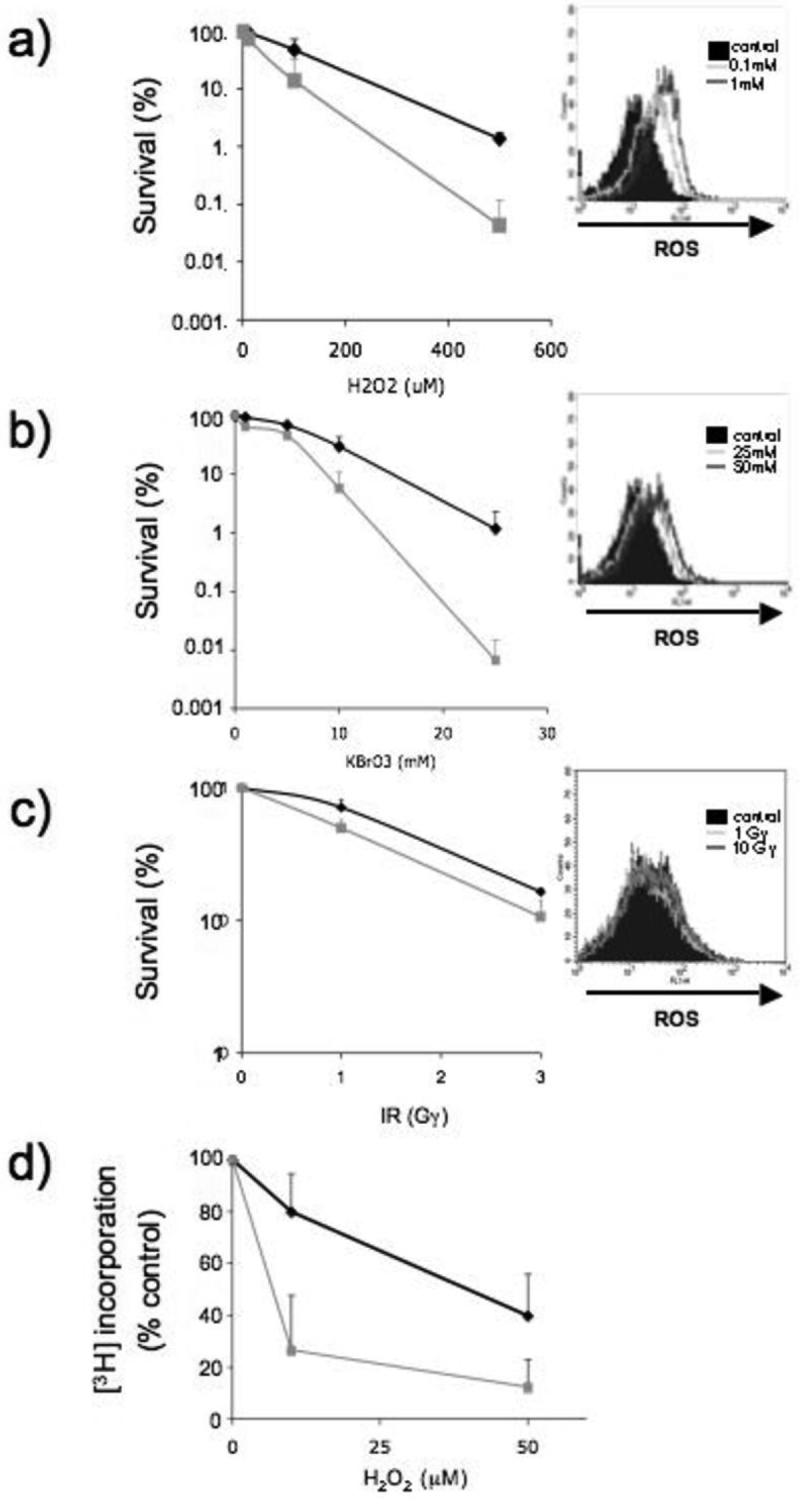
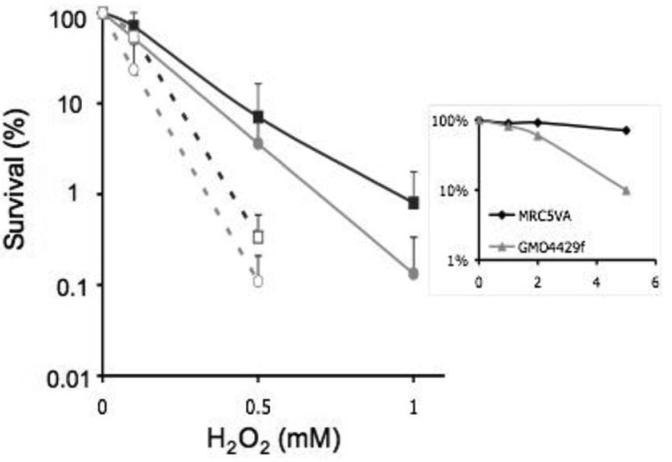
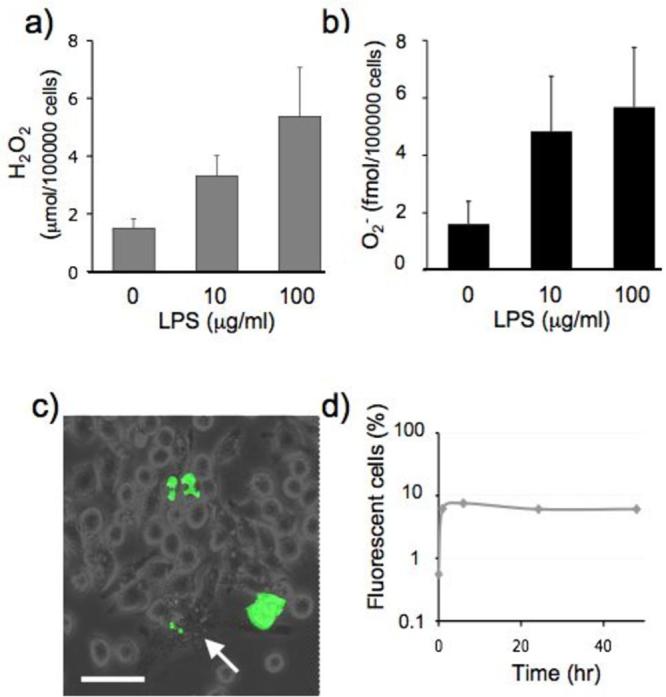
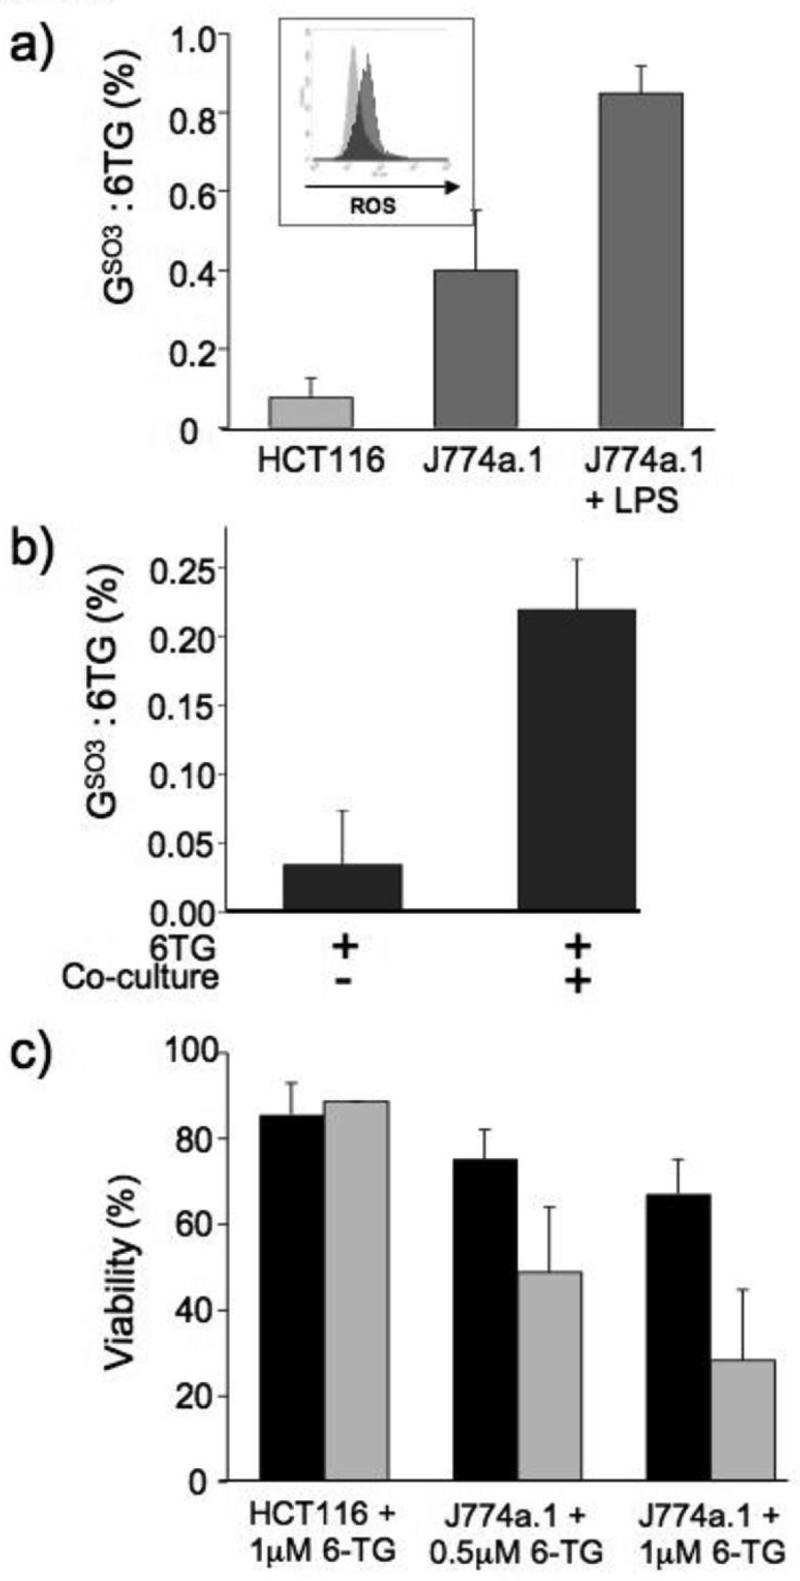
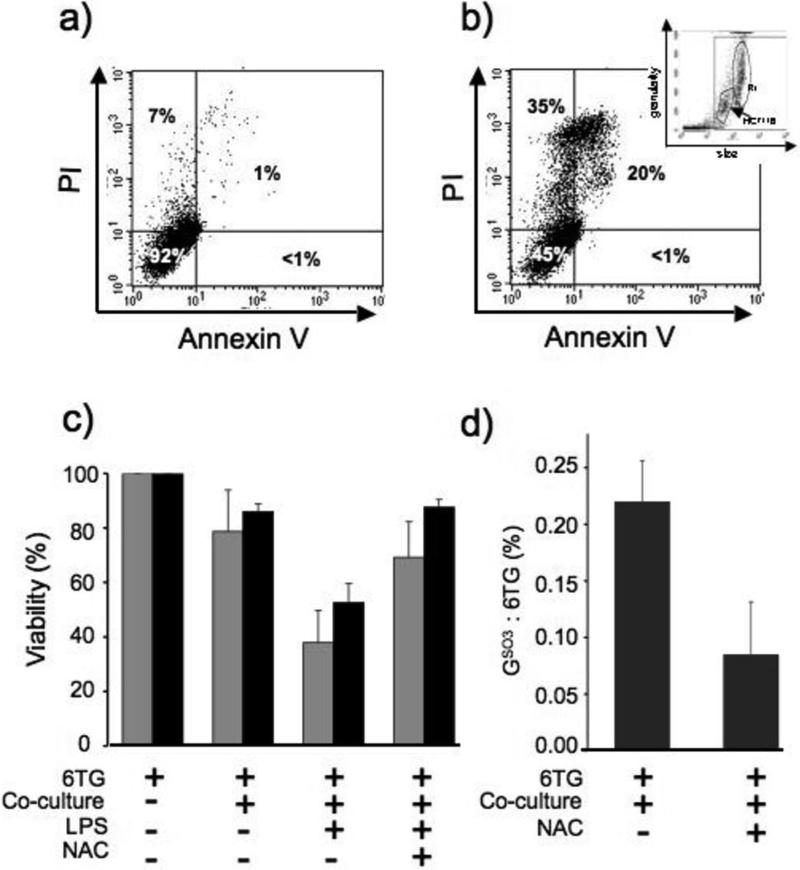
Azathioprine, a widely used immunosuppressant, is also used in the control of inflammatory disorders. These are characterized by the local accumulation of immune effector cells that produce reactive oxygen species (ROS). The DNA of azathioprine-treated patients contains 6-thioguanine (6-TG), a base analogue that is particularly susceptible to oxidation. Here, we show that 6-TG is vulnerable to ROS produced by chemical oxidants and that cells containing DNA 6-TG are hypersensitive to these oxidants. We also show that 6-TG incorporated into the DNA of macrophages sensitizes them to killing by endogenously produced ROS. ROS generated by macrophages are also a hazard for cocultured nonmacrophage cells containing DNA 6-TG. This bystander vulnerability of cells containing DNA 6-TG to oxidation by ROS generated by immune effector cells has implications for the long-term use of azathioprine in the management of inflammatory disorders.
Figures
Similar articles
-
Reactive oxygen species generated by thiopurine/UVA cause irreparable transcription-blocking DNA lesions.Nucleic Acids Res. 2009 Apr;37(6):1951-61. doi: 10.1093/nar/gkp070. Epub 2009 Feb 10. Nucleic Acids Res. 2009. PMID: 19208641 Free PMC article.
-
Oxidation-mediated DNA cross-linking contributes to the toxicity of 6-thioguanine in human cells.Cancer Res. 2012 Sep 15;72(18):4787-95. doi: 10.1158/0008-5472.CAN-12-1278. Epub 2012 Jul 20. Cancer Res. 2012. PMID: 22822082
-
Azathioprine and UVA light generate mutagenic oxidative DNA damage.Science. 2005 Sep 16;309(5742):1871-4. doi: 10.1126/science.1114233. Science. 2005. PMID: 16166520 Free PMC article.
-
Multiple forms of DNA damage caused by UVA photoactivation of DNA 6-thioguanine.Photochem Photobiol. 2012 Jan-Feb;88(1):5-13. doi: 10.1111/j.1751-1097.2011.01043.x. Epub 2011 Dec 16. Photochem Photobiol. 2012. PMID: 22077233 Review.
-
Innovating Thiopurine Therapeutic Drug Monitoring: A Systematic Review and Meta-Analysis on DNA-Thioguanine Nucleotides (DNA-TG) as an Inclusive Biomarker in Thiopurine Therapy.Clin Pharmacokinet. 2024 Aug;63(8):1089-1109. doi: 10.1007/s40262-024-01393-0. Epub 2024 Jul 20. Clin Pharmacokinet. 2024. PMID: 39031224 Free PMC article.
Cited by
-
Protein oxidation and DNA repair inhibition by 6-thioguanine and UVA radiation.J Invest Dermatol. 2014 May;134(5):1408-1417. doi: 10.1038/jid.2013.509. Epub 2013 Nov 27. J Invest Dermatol. 2014. PMID: 24284422
-
Direct observation and quantitative characterization of singlet oxygen in aqueous solution upon UVA excitation of 6-thioguanines.J Phys Chem B. 2011 Mar 3;115(8):1889-94. doi: 10.1021/jp109590t. Epub 2011 Feb 4. J Phys Chem B. 2011. PMID: 21294562 Free PMC article.
-
Guanine sulphinate is a major stable product of photochemical oxidation of DNA 6-thioguanine by UVA irradiation.Nucleic Acids Res. 2010 Apr;38(6):1832-40. doi: 10.1093/nar/gkp1165. Epub 2009 Dec 21. Nucleic Acids Res. 2010. PMID: 20026585 Free PMC article.
-
The Inhibitory Effects of 6-Thioguanine and 6-Mercaptopurine on the USP2a Target Fatty Acid Synthase in Human Submaxillary Carcinoma Cells.Front Oncol. 2021 Dec 10;11:749661. doi: 10.3389/fonc.2021.749661. eCollection 2021. Front Oncol. 2021. PMID: 34956872 Free PMC article.
-
Review article: the role of oxidative stress in pathogenesis and treatment of inflammatory bowel diseases.Naunyn Schmiedebergs Arch Pharmacol. 2014 Jul;387(7):605-20. doi: 10.1007/s00210-014-0985-1. Epub 2014 May 6. Naunyn Schmiedebergs Arch Pharmacol. 2014. PMID: 24798211 Free PMC article. Review.
References
-
- Bernstein CN, Blanchard JF, Kliewer E, Wajda A. Cancer risk in patients with inflammatory bowel disease. Cancer. 2001;91:854–62. - PubMed
-
- Gaffney K, Scott DGI. Azathioprine and cyclophosphamide in the treatment of rheumatoid arthritis. Br J Rheumatol. 1998;37:824–36. - PubMed
-
- Pearson DC, May GR, Fick GH, Sutherland LR. Azathioprine and 6-mercaptopurine in Crohn disease. A meta-analysis. Ann Intern Med. 1995;123:132–42. - PubMed
-
- Warren DJ, Andersen A, Slordal L. Quantitation of 6-thioguanine residues in peripheral blood leukocyte DNA obtained from patients receiving 6-mercaptopurine-based maintenance therapy. Cancer Res. 1995;55:1670–4. - PubMed
-
- Cuffari C, Seidmen EG, Latour S, Theoret Y. Quantitation of 6-thioguanine in preipheral blood leukocyte DNA in Crohn's disease patients on maintenance 6-mercaptopurine therapy. Can J Physiol Pharmacol. 1996;74:580–5. - PubMed
Publication types
MeSH terms
Substances
Grants and funding
LinkOut - more resources
Full Text Sources
Miscellaneous
