. 2009 Mar 1;69(5):2091-9.
doi: 10.1158/0008-5472.CAN-08-2100. Epub 2009 Feb 24.

Unsupervised analysis of transcriptomic profiles reveals six glioma subtypes

Affiliations

Unsupervised analysis of transcriptomic profiles reveals six glioma subtypes

Aiguo Li et al. Cancer Res. .

Abstract

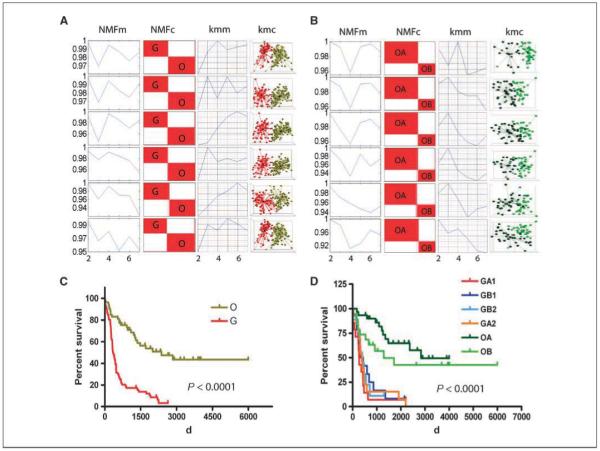
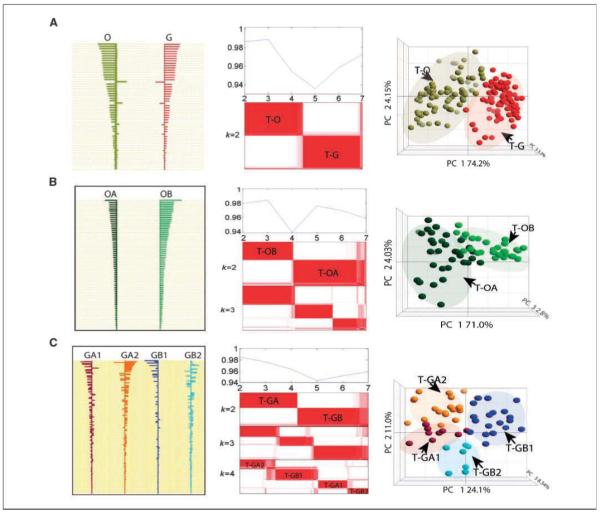
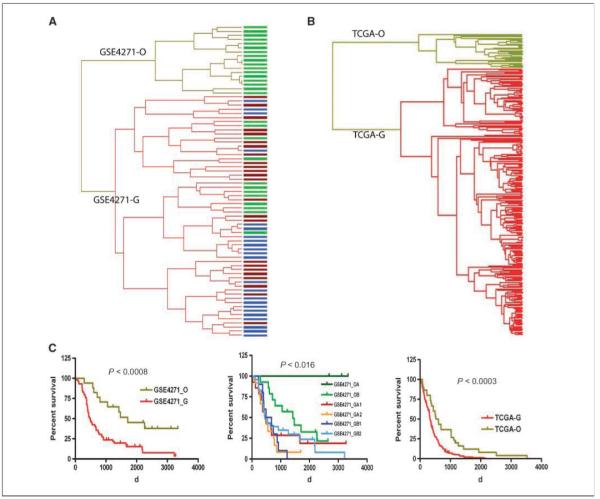
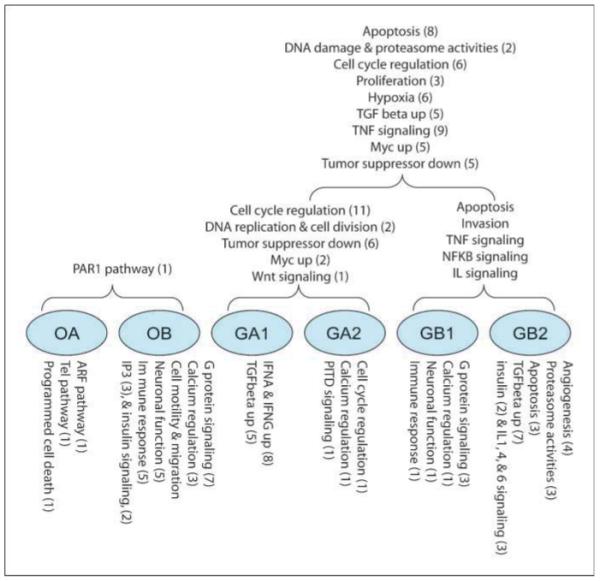
Gliomas are the most common type of primary brain tumors in adults and a significant cause of cancer-related mortality. Defining glioma subtypes based on objective genetic and molecular signatures may allow for a more rational, patient-specific approach to therapy in the future. Classifications based on gene expression data have been attempted in the past with varying success and with only some concordance between studies, possibly due to inherent bias that can be introduced through the use of analytic methodologies that make a priori selection of genes before classification. To overcome this potential source of bias, we have applied two unsupervised machine learning methods to genome-wide gene expression profiles of 159 gliomas, thereby establishing a robust glioma classification model relying only on the molecular data. The model predicts for two major groups of gliomas (oligodendroglioma-rich and glioblastoma-rich groups) separable into six hierarchically nested subtypes. We then identified six sets of classifiers that can be used to assign any given glioma to the corresponding subtype and validated these classifiers using both internal (189 additional independent samples) and two external data sets (341 patients). Application of the classification system to the external glioma data sets allowed us to identify previously unrecognized prognostic groups within previously published data and within The Cancer Genome Atlas glioblastoma samples and the different biological pathways associated with the different glioma subtypes offering a potential clue to the pathogenesis and possibly therapeutic targets for tumors within each subtype.


Figures

Figure 1
Figure 1
Glioma classification based on two unsupervised machine learning methods: k-mean clustering and nonnegative matrix factorization (NMF) in train set and Kaplan-Meier survival analysis of subtypes. Model selections, NMF consensus matrices, and k-mean clusters (k = 2) of two glioma main types in six probeset subsets (A) and of OA and OB subclasses in six probeset subsets (B). NMFm, NMF model selections based on cophenetic correlation (in a high consensus matrix, the coefficient is close to 1); NMFc, NMF consensus matrices; Kmm, k-mean model selections based on David-Bouldin Index (the smaller the index, the tighter the cluster); Kmc, k-mean clusters. Kaplan-Meier survival analysis for O and G main types (C) and for six subtypes (D). The color scheme representing the six subtypes of glioma throughout the figures is as follows: red, O main type; olive, G main type; dark green, OA subtype; green, OB subtype; dark red, GA1 subtype; orange, GA2 subtype; blue, GB1 subtype; turquoise, GB2 subtype.
Figure 2
Figure 2
Classifier identification using PAM and their validation in a test set. A, shrunken differences of 54 classifiers for differentiation of O and G types (left); NMF model selections and consensus matrixes (k = 2) of two main types in test set (middle); validation of the 54 classifiers in the test set using PCA (right). B, shrunken differences of the 69 classifiers for differentiation of OA and OB subtypes (left); NMF model selections and consensus matrices (k = 2, k = 3) of OA and OB subtypes in the test set (middle); validation of the 69 classifiers in the test set using PCA (right). C, shrunken differences of the 352 classifiers for differentiation of four G subtypes (GA1, GA2, GB1, and GB2; left); NMF model selections and consensus matrices (k = 2, k = 3, k = 4) of subtypes in GBM-rich type in test set (middle); validation of the 352 classifiers in the test set using PCA (right).
Figure 3
Figure 3
Glioma classification for the external data sets (GSE4271 data set and TCGA date set) using the classifiers. A, hierarchical clustering of GSE4271 data set using 53 classifiers to separate the two main types. Top branch of the dendrogram represents GSE4271-O main type; lower branch represents the GSE4271-G main type. Size of GSE4271-O type is smaller due to the restricted nature of the GSE4271 data set (only high-grade gliomas present). B, hierarchical clustering of TCGA GBM data set using classifiers to separate the two main types. The top branch of the dendrogram represents TCGA-O main type, whereas the lower branch represents the TCGA-G main type. Size of O type is smaller due to the restricted nature of the TCGA GBM data set (only grade IV gliomas present). C, Kaplan-Meier survival analysis of the two main types (left) and the six subtypes (center) derived from GSE4271 data set as well as the two main types of TCGA GBM samples (right). Bar colors in dendrogram represent the three subtypes identified in the original article: green, proneural subtype; dark red, proliferative subtype; blue, mesenchymal subtype.
Figure 4
Figure 4
Overview of the biological functions found enriched in six subtypes based on the significantly up-regulated gene sets from GSEA analysis (nominal P < 0.05) as compared pairwise according to their hierarchically nested relationship. The numbers in parenthesis represent the number of gene sets in the categories found to be significant in the GSEA analysis.

References

    1. Cancer Statistics Branch N. NIH . Cancer Survival rates. In: Harras A, editor. Cancer: Rates & Risks. US Dept of Health & Human Services, National Institutes of Health; Washington (DC): 1996. pp. 28–34.
    1. Godard S, Getz G, Delorenzi M, et al. Classification of human astrocytic gliomas on the basis of gene expression: a correlated group of genes with angiogenic activity emerges as a strong predictor of subtypes. Cancer Res. 2003;63:6613–25. - PubMed
    1. Shai R, Shi T, Kremen TJ, et al. Gene expression profiling identifies molecular subtypes of gliomas. Oncogene. 2003;22:4918–23. - PubMed
    1. Louis DN, Ohgaki H, Wiestler OD, et al. The 2007 WHO classification of tumours of the central nervous system. Acta Neuropathol (Berl) 2007;114:97–109. - PMC - PubMed
    1. Ohgaki H, Dessen P, Jourde B, et al. Genetic pathways to glioblastoma: a population-based study. Cancer Res. 2004;64:6892–9. - PubMed

Publication types