. 2009 Jul;23(7):2317-26.
doi: 10.1096/fj.08-122523. Epub 2009 Feb 24.

The long lifespan of two bat species is correlated with resistance to protein oxidation and enhanced protein homeostasis

Affiliations

The long lifespan of two bat species is correlated with resistance to protein oxidation and enhanced protein homeostasis

Adam B Salmon et al. FASEB J. 2009 Jul.

Abstract

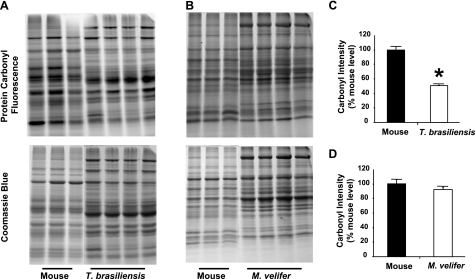
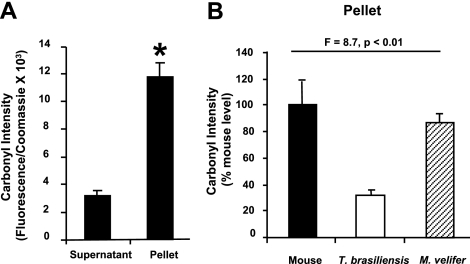
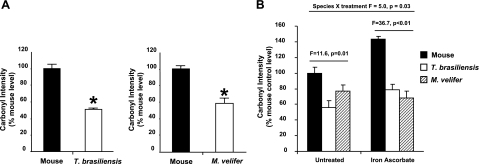
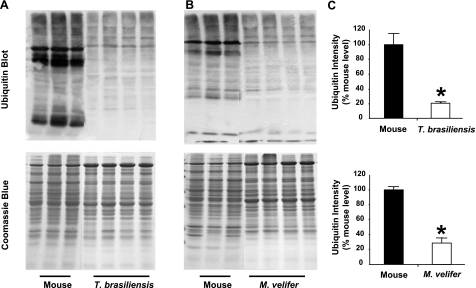
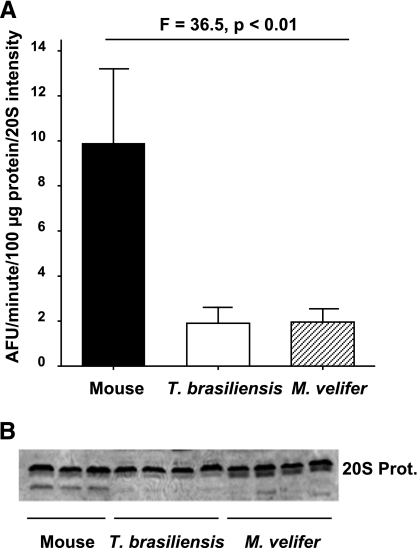
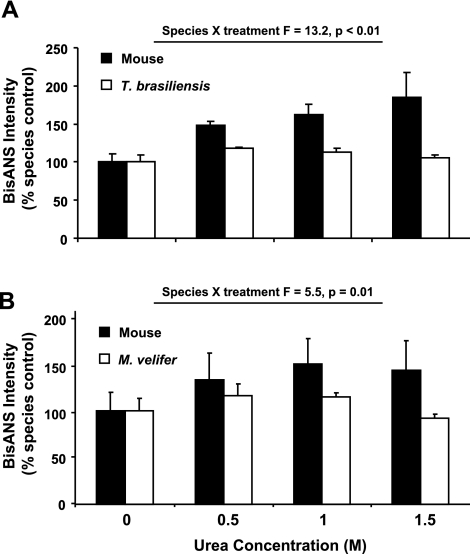
Altered structure, and hence function, of cellular macromolecules caused by oxidation can contribute to loss of physiological function with age. Here, we tested whether the lifespan of bats, which generally live far longer than predicted by their size, could be explained by reduced protein damage relative to short-lived mice. We show significantly lower protein oxidation (carbonylation) in Mexican free-tailed bats (Tadarida brasiliensis) relative to mice, and a trend for lower oxidation in samples from cave myotis bats (Myotis velifer) relative to mice. Both species of bat show in vivo and in vitro resistance to protein oxidation under conditions of acute oxidative stress. These bat species also show low levels of protein ubiquitination in total protein lysates along with reduced proteasome activity, suggesting diminished protein damage and removal in bats. Lastly, we show that bat-derived protein fractions are resistant to urea-induced protein unfolding relative to the level of unfolding detected in fractions from mice. Together, these data suggest that long lifespan in some bat species might be regulated by very efficient maintenance of protein homeostasis.


Figures

Figure 1.
Figure 1.
Protein carbonyl levels are relatively lower in samples from bat species relative to those from mice. A) Representative SDS-PAGE gel showing carbonyl probe fluorescence and total protein as measured by Coomassie blue stain in samples from liver homogenates from house mice and T. brasiliensis. B) As in A, comparing liver homogenates from house mice and M. velifer. C) Relative carbonyl levels for mice (n=3 animals) and T. brasiliensis (n=4 animals), presented as carbonyl intensity (carbonyl fluorescence/total protein as measured by Coomassie blue) relative to average intensity for mice. Bars represent means ± se. *P < 0.01; t test. D) As in C, comparing carbonyl levels for mice (n=3 animals) and M. velifer (n=4 animals).
Figure 2.
Figure 2.
Protein carbonyl levels are relatively lower in samples from bats in both supernatant and pellet fractions of protein homogenates. A) Relative carbonyl levels in supernatant fraction and insoluble pellet fraction of liver homogenates from mice (n=3 animals) presented as carbonyl intensity (carbonyl fluorescence/total protein as measured by Coomassie blue). Bars represent means ± se. *P < 0.01; t test. B) Relative carbonyl levels in pellet fraction of liver homogenates from mice (n=5 animals), T. brasiliensis (n=5 animals), and M. velifer (n=5 animals), presented as carbonyl intensity (carbonyl fluorescence/total protein as measured by Coomassie blue) relative to average intensity for mice. Bars represent means ± se. F and P values represent 1-way ANOVA for data comparing all three species.
Figure 3.
Figure 3.
Protein carbonyl levels following oxidative stress are relatively lower in samples from bat species than those from mice. A) Relative carbonyl levels in liver homogenates from irradiated mice (n=3 animals) and T. brasiliensis (n=4 animals) or for irradiated mice (n=3 animals) and M. velifer (n=4 animals), presented as carbonyl intensity (carbonyl fluorescence/total protein as measured by Coomassie blue) relative to average intensity for mice. Bars represent means ± se. *P < 0.01; t test. B) Relative carbonyl levels in liver homogenates from mice (n=3 animals), T. brasiliensis (n=3 animals), and M. velifer (n=3 animals) after treatment with iron ascorbate. Bars represent means ± se. F and P values represent 1-way ANOVA for data within either control or treated samples.
Figure 4.
Figure 4.
Protein ubiquitination levels are relatively lower in samples from bat species relative to those from mice. A) Representative Western blot showing signal obtained after incubation with primary antibody for ubiquitin and total protein as measured by Coomassie blue stain in samples from liver homogenates from house mice and T. brasiliensis. B) As in A, comparing liver homogenates from house mice and M. velifer. C) Relative ubiquitin levels for mice (n=3 animals) and T. brasiliensis (n=4 animals) or for mice (n=3 animals) and M. velifer (n=4 animals), presented as ubiquitin intensity (ubiquitin signal/total protein as measured by Coomassie blue) relative to the average intensity for mice. Bars represent means ± se. *P < 0.01; t test.
Figure 5.
Figure 5.
Tissue homogenates from bat species show relatively low 20S proteasome chymotrypsin-like activity. A) 20S proteasome-specific activity in liver homogenates from mice (n=3 animals), T. brasiliensis (n=4 animals), and M. velifer (n=4 animals), presented as specific activity (fluorescence units/minute/100 μg protein/intensity of 20S signal from Western blot). Bars represent means ± se. F and P values represent 1-way ANOVA for data within either control or treated samples. B) Representative Western blot showing intensity of signal following incubation with primary antibody for 20S proteasome. Each lane represents 20 μg total protein from liver homogenates.
Figure 6.
Figure 6.
Proteins from bat species are relatively resistant to unfolding caused by incubation with urea. A) Relative BisANS intensity for total protein homogenates from mice and T. brasiliensis incubated in different concentrations of urea. Bars represent means ± se. For each species, BisANS intensity for each sample was normalized to the BisANS intensity for the untreated sample from that species. B) As in A, comparing samples from mice and M. velifer.

References

    1. Finch C E. Chicago: University of Chicago Press; Longevity, Senescence and the Genome. 1990
    1. George J C, Bada J, Zeh J, Scott L, Brown S E, O'Hara T, Suydam R. Age and growth estimates of bowhead whales (Balaena mysticetus) via aspartic acid racemization. Can J Zool. 1999;77:571–580.
    1. Austad S N, Fischer K E. Mammalian aging, metabolism, and ecology: evidence from the bats and marsupials. J Gerontol A Biol Sci Med Sci. 1991;46:B47–B53. - PubMed
    1. Wilkinson G S, South J M. Life history, ecology and longevity in bats. Aging Cell. 2002;1:124–131. - PubMed
    1. Jürgens K D, Prothero J. Scaling of maximal lifespan in bats. Comp Biochem Physiol. 1987;88A:361–367. - PubMed

Publication types

LinkOut - more resources