

Cross-talk between type three secretion system and metabolism in Yersinia
- PMID: 19244229
- PMCID: PMC2673285
- DOI: 10.1074/jbc.M900773200
Cross-talk between type three secretion system and metabolism in Yersinia
Abstract
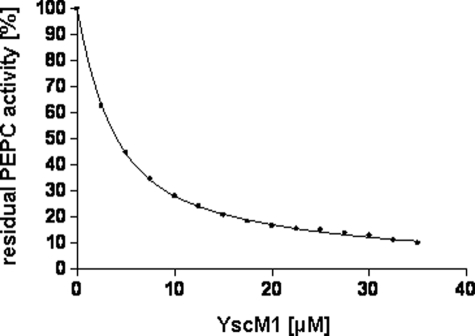
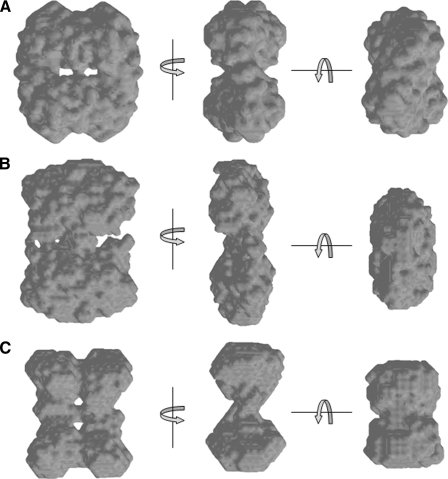
Pathogenic yersiniae utilize a type three secretion system (T3SS) to inject Yop proteins into host cells in order to undermine their immune response. YscM1 and YscM2 proteins have been reported to be functionally equivalent regulators of the T3SS in Yersinia enterocolitica. Here, we show by affinity purification, native gel electrophoresis and small angle x-ray scattering that both YscM1 and YscM2 bind to phosphoenolpyruvate carboxylase (PEPC) of Y. enterocolitica. Under in vitro conditions, YscM1, but not YscM2, was found to inhibit PEPC with an apparent IC(50) of 4 mum (K(i) = 1 mum). To analyze the functional roles of PEPC, YscM1, and YscM2 in Yop-producing bacteria, cultures of Y. enterocolitica wild type and mutants defective in the formation of PEPC, YscM1, or YscM2, respectively, were grown under low calcium conditions in the presence of [U-(13)C(6)]glucose. The isotope compositions of secreted Yop proteins and nine amino acids from cellular proteins were analyzed by mass spectrometry. The data indicate that a considerable fraction of oxaloacetate used as precursor for amino acids was derived from [(13)C(3)]phosphoenolpyruvate by the catalytic action of PEPC in the wild-type strain but not in the PEPC(-) mutant. The data imply that PEPC is critically involved in replenishing the oxaloacetate pool in the citrate cycle under virulence conditions. In the YscM1(-) and YscM2(-) mutants, increased rates of pyruvate formation via glycolysis or the Entner-Doudoroff pathway, of oxaloacetate formation via the citrate cycle, and of amino acid biosynthesis suggest that both regulators trigger the central metabolism of Y. enterocolitica. We propose a "load-and-shoot cycle" model to account for the cross-talk between T3SS and metabolism in pathogenic yersiniae.
Figures


Similar articles
-
Yersinia enterocolitica type III secretion: yscM1 and yscM2 regulate yop gene expression by a posttranscriptional mechanism that targets the 5' untranslated region of yop mRNA.J Bacteriol. 2002 Nov;184(21):5880-93. doi: 10.1128/JB.184.21.5880-5893.2002. J Bacteriol. 2002. PMID: 12374821 Free PMC article.
-
Binding of SycH chaperone to YscM1 and YscM2 activates effector yop expression in Yersinia enterocolitica.J Bacteriol. 2004 Feb;186(3):829-41. doi: 10.1128/JB.186.3.829-841.2004. J Bacteriol. 2004. PMID: 14729710 Free PMC article.
-
YscM1 and YscM2, two Yersinia enterocolitica proteins causing downregulation of yop transcription.Mol Microbiol. 1997 Nov;26(4):833-43. doi: 10.1046/j.1365-2958.1997.6281995.x. Mol Microbiol. 1997. PMID: 9427412
-
[Functions of plant phosphoenolpyruvate carboxylase and its applications for genetic engineering].Sheng Wu Gong Cheng Xue Bao. 2011 Dec;27(12):1702-10. Sheng Wu Gong Cheng Xue Bao. 2011. PMID: 22506410 Review. Chinese.
-
The remarkable diversity of plant PEPC (phosphoenolpyruvate carboxylase): recent insights into the physiological functions and post-translational controls of non-photosynthetic PEPCs.Biochem J. 2011 May 15;436(1):15-34. doi: 10.1042/BJ20110078. Biochem J. 2011. PMID: 21524275 Review.
Cited by
-
Coregulation of host-adapted metabolism and virulence by pathogenic yersiniae.Front Cell Infect Microbiol. 2014 Oct 20;4:146. doi: 10.3389/fcimb.2014.00146. eCollection 2014. Front Cell Infect Microbiol. 2014. PMID: 25368845 Free PMC article. Review.
-
Visualization of translocons in Yersinia type III protein secretion machines during host cell infection.PLoS Pathog. 2018 Dec 26;14(12):e1007527. doi: 10.1371/journal.ppat.1007527. eCollection 2018 Dec. PLoS Pathog. 2018. PMID: 30586431 Free PMC article.
-
Environmental Regulation of Yersinia Pathophysiology.Front Cell Infect Microbiol. 2016 Mar 2;6:25. doi: 10.3389/fcimb.2016.00025. eCollection 2016. Front Cell Infect Microbiol. 2016. PMID: 26973818 Free PMC article. Review.
-
Links between type III secretion and extracytoplasmic stress responses in Yersinia.Front Cell Infect Microbiol. 2012 Oct 10;2:125. doi: 10.3389/fcimb.2012.00125. eCollection 2012. Front Cell Infect Microbiol. 2012. PMID: 23087910 Free PMC article. Review.
-
The pyruvate-tricarboxylic acid cycle node: a focal point of virulence control in the enteric pathogen Yersinia pseudotuberculosis.J Biol Chem. 2014 Oct 24;289(43):30114-32. doi: 10.1074/jbc.M114.581348. Epub 2014 Aug 27. J Biol Chem. 2014. PMID: 25164818 Free PMC article.
References
Publication types
MeSH terms
Substances
LinkOut - more resources
Full Text Sources
