. 2009 Apr;20(8):2297-310.
doi: 10.1091/mbc.e08-09-0939. Epub 2009 Feb 25.

Caveolin-1-mediated suppression of cyclooxygenase-2 via a beta-catenin-Tcf/Lef-dependent transcriptional mechanism reduced prostaglandin E2 production and survivin expression

Affiliations

Caveolin-1-mediated suppression of cyclooxygenase-2 via a beta-catenin-Tcf/Lef-dependent transcriptional mechanism reduced prostaglandin E2 production and survivin expression

Diego A Rodriguez et al. Mol Biol Cell. 2009 Apr.

Abstract

Augmented expression of cyclooxygenase-2 (COX-2) and enhanced production of prostaglandin E(2) (PGE(2)) are associated with increased tumor cell survival and malignancy. Caveolin-1 is a scaffold protein that has been proposed to function as a tumor suppressor in human cancer cells, although mechanisms underlying this ability remain controversial. Intriguingly, the possibility that caveolin-1 regulates the expression of COX-2 has not been explored. Here we show that augmented caveolin-1 expression in cells with low basal levels of this protein, such as human colon cancer (HT29, DLD-1), breast cancer (ZR75), and embryonic kidney (HEK293T) cells reduced COX-2 mRNA and protein levels and beta-catenin-Tcf/Lef and COX-2 gene reporter activity, as well as the production of PGE(2) and cell proliferation. Moreover, COX-2 overexpression or PGE(2) supplementation increased levels of the inhibitor of apoptosis protein survivin by a transcriptional mechanism, as determined by PCR analysis, survivin gene reporter assays and Western blotting. Furthermore, addition of PGE(2) to the medium prevented effects attributed to caveolin-1-mediated inhibition of beta-catenin-Tcf/Lef-dependent transcription. Finally, PGE(2) reduced the coimmunoprecipitation of caveolin-1 with beta-catenin and their colocalization at the plasma membrane. Thus, by reducing COX-2 expression, caveolin-1 interrupts a feedback amplification loop involving PGE(2)-induced signaling events linked to beta-catenin/Tcf/Lef-dependent transcription of tumor survival genes including cox-2 itself and survivin.


Figures

Figure 1.
Figure 1.
Caveolin-1 reduced COX-2 mRNA and protein levels in breast (ZR75) and colon [HT29(ATCC), DLD-1] cancer cell lines. Results obtained with ZR75 (A), DLD-1 (B), or HT29(ATCC) (C) cells stably transfected with the plasmids pLacIOP (−) or pLacIOP-caveolin-1 (+) are shown. Cells (2 × 10⁶) were seeded in 60-mm plates and grown in all cases for 24 h in the presence of 1 mM IPTG. COX-2 mRNA levels were assessed by semiquantitative RT-PCR analysis (RT-PCR). Actin was used as an internal control. Numerical data shown were averaged from three independent experiments (mean ± SEM). Residual COX-2 levels in the presence of caveolin-1 were (A) ZR75, 0.56 ± 0.06; (B) DLD-1, 0.54 ± 0.1; and (C) HT29(ATCC), 0.55 ± 0.06. Statistically significant differences between results for pLacIOP (−) and pLacIOP-caveolin-1 (+) transfected cells are indicated; #p < 0.05. Also, total protein extracts from ZR75, DLD-1, or HT29(ATCC) cells were separated by SDS-PAGE (80 μg/lane) and analyzed by Western blotting (WB) with anti-COX-2, anti-caveolin-1, or anti-actin antibodies. COX-2 levels were quantified by scanning densitometric analysis of Western blots and normalized to actin. COX-2 protein levels in cells transfected with pLacIOP-caveolin-1 were compared with those in pLacIOP controls, both in the presence of 1 mM IPTG. Numerical data were averaged from three independent experiments (mean ± SEM). Residual COX-2 levels in the presence of caveolin-1 were as follows: (A) ZR75, 0.46 ± 0.08; (B) DLD-1, 0.41 ± 0.05; and (C) HT29(ATCC), 0.42 ± 0.07. (D) COX-2 mRNA levels were compared by real-time qPCR analysis. Ribosomal 18S RNA was used as an internal control. Values shown were averaged from three independent experiments (mean ± SEM). Statistically significant differences between results obtained for cells transfected with pLacIOP (−) or pLacIOP-cav-1 (+) are indicated; *p < 0.01; #p < 0.05.
Figure 2.
Figure 2.
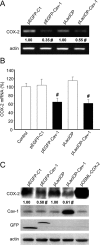
Caveolin-1 reduced COX-2 mRNA and protein levels in HEK293T cells. (A) HEK293T cells were transiently transfected with the plasmids pEGFP-C1, pEGFP-caveolin-1, pLacIOP, or pLacIOP-caveolin-1 (2 μg in each case). After transfection, the cells were grown 24 h either in the absence (pEGFP-C1, pEGFP-caveolin-1) or presence of 1 mM IPTG (pLacIOP and pLacIOP-caveolin-1). Semiquantitative RT-PCR analysis was performed using specific primers for COX-2 or actin as an internal control. Numerical data were averaged from three independent experiments (mean ± SEM). Residual COX-2 levels in the presence of caveolin-1 were 0.35 ± 0.07 (pEGFP-caveolin-1) and 0.55 ± 0.07 (pLacIOP-caveolin-1), respectively. Statistically significant differences with respect to mock controls are indicated; #p < 0.05. (B) Quantitative real-time qPCR analysis of HEK293T cells transiently transfected as in A. Data were normalized to values obtained with nontransfected cells (100%). Ribosomal 18S RNA was used as an internal control. Results shown were averaged from three independent experiments (mean ± SEM). Statistically significant differences with respect to mock controls are indicated; #p < 0.05. (C) Western blot analysis of HEK293T cells transiently transfected with the plasmids pEGFP-C1, pEGFP-caveolin-1, pLacIOP, or pLacIOP-caveolin-1 and grown for 24 h after transfection as indicated in A. Protein extracts were prepared, separated by SDS-PAGE (80 μg/lane), and analyzed by Western blotting with anti-COX-2, anti-caveolin-1, anti-GFP, or anti-actin antibodies. As a positive control for COX-2 expression, cells were transiently transfected with 2 μg of the COX-2 expression plasmid pOSML-COX-2. Numerical data were obtained by scanning densitometric analysis of Western blots and normalized to actin. Results shown were averaged from three independent experiments (mean ± SEM). Residual COX-2 levels in the presence of caveolin-1 were 0.58 ± 0.12 (pEGFP-caveolin-1) and 0.61 ± 0.10 (pLacIOP-caveolin-1), respectively. Statistically significant differences with respect to mock controls are indicated; #p < 0.05.
Figure 3.
Figure 3.
Caveolin-1–mediated suppression of COX-2 in different cell lines involved the β-catenin-Tcf/Lef pathway. HEK293T cells were transiently cotransfected with the reporter plasmids pTOP-FLASH or pFOP-FLASH and pLacIOP or pLacIOP-caveolin-1 (2 μg each). After transfection, cells were incubated with 1 mM of IPTG for 24 h. Additionally, HEK293T cells were cultured after transfection in the presence or absence of lithium (20 mM) or SB-216763 (10 μM; both GSK-3β inhibitors). (A) After 24 h, cells were harvested and prepared for the Tcf/Lef reporter assay and semiquantitative RT-PCR analysis as described. Bar graph: luciferase activity was normalized by calculating the pTOP-FLASH (three functional TBE in tandem)/pFOP-FLASH (all TBEs mutated) activity ratio for each condition. Data were normalized to values obtained in control cells transfected with pLacIOP (100%). Results from three independent experiments were averaged (mean ± SEM). Statistically significant differences compared with control cells are indicated (*p < 0.01; #p < 0.05). COX-2 mRNA levels were assessed by semiquantitative RT-PCR using COX-2–specific primers. (B) Total protein extracts (80 μg/lane) were separated by SDS-PAGE and analyzed by Western blotting with anti-COX-2, anti-β-catenin, anti-survivin, anti-caveolin-1, or anti-actin antibodies. Data shown are representative of results obtained in three independent experiments. (C) HEK293T cells were transiently cotransfected with the reporter plasmids pGL3-COX-2 (COX-2 promoter) or pGL3 (empty vector) and pLacIOP or pLacIOP-caveolin-1 (2 μg each). After transfection, cells were treated with GSK-3β inhibitors, as indicated. Reporter activity was normalized by calculating the pGL3-COX-2/pGL3 activity for each condition. Data shown were averaged from three independent experiments (mean ± SEM). Statistically significant differences with respect to mock controls are indicated; *p < 0.01; #p < 0.05. (D and E) ZR75 and DLD-1 cells stably transfected with pLacIOP (Cav-1 (−)) or pLacIOP-caveolin-1 (Cav-1 (+)), were additionally transfected with pGL3 or pGL3-COX-2 (each 2 μg) and cultured for 24 h in presence or absence of the specific GSK-3β inhibitor SB-216763 (10 μM). Then, cell extracts were prepared, and reporter activity was determined as described. pGL3-COX-2/pGL3 activity ratios were calculated for each condition. Values obtained for control cells stably transfected with pLacIOP were defined as 100%. Data were averaged from three independent experiments (mean ± SEM). Statistically significant differences with respect to mock controls are indicated; *p < 0.01; #p < 0.05.
Figure 4.
Figure 4.
Overexpression of COX-2 augmented PGE2 production, up-regulated survivin expression and promoted proliferation in HEK293T cells. HEK293T cells were transiently transfected with increasing amounts (0, 0.5, 1.0, 2.0, and 4.0 μg) of the plasmid encoding COX-2 (pOSML-COX-2; A–C), and in C additionally were cotransfected with 1.0 μg of the different luciferase reporter plasmids: pTOP-FLASH, pFOP-FLASH, pLuc-1710 (survivin promoter with three TBEs), pLuc-420-3M (survivin promoter with 2 TBEs where the critical one is mutated), pGL3-COX-2 (COX-2 promoter), and pGL3 (empty vector). After transfection cells were cultured for 24 h and prepared for the following: (A) Semiquantitative RT-PCR analysis of COX-2 and survivin mRNA levels. Actin was used as internal control. Numerical data are the means of results obtained in three independent experiments. Relative survivin mRNA levels compared with controls were (mean ± SEM): 2.0 ± 0.07, 2.1 ± 0.05, and 2.8 ± 0.1, with 1, 2, and 4 μg of pOSML-COX-2, respectively. (B) Western blot analysis of HEK293T cells. Total protein extracts (80 μg/lane) were separated by SDS-PAGE and analyzed by Western blotting with anti-COX-2, anti-β-catenin, anti-survivin, or anti-actin antibodies. Numerical data were obtained by scanning densitometric analysis. Values shown were normalized to actin and averaged from three different experiments (mean ± SEM). Relative β-catenin protein levels compared with controls were: 2.6 ± 0.04, 2.7 ± 0.0, and 2.4 ± 0.08, with 1, 2 and 4 μg of pOSML-COX-2, respectively. Relative survivin protein levels compared with controls were 2.5 ± 0.04, 4.2 ± 0.08, and 4.6 ± 0.08, with 1, 2, and 4 μg of pOSML-COX-2, respectively. Statistically significant differences with respect to mock controls found in A and B are indicated; *p < 0.01; #p < 0.05. (C) Reporter activity was determined and normalized by calculating the pTOP-FLASH/pFOP-FLASH, pLuc-1710/pLuc-420–3M, and pGL3-COX-2/pGL3 activity ratios. Data from three independent experiments were averaged (mean ± SEM). Values were standardized relative to those obtained for control cells not transfected with the plasmid encoding COX-2 (100%). Statistically significant differences detected by multiple comparisons using ANOVA are indicated; *p < 0.01; #p < 0.05. (D) PGE2 production was quantified using the EIA monoclonal assay kit. After transfection with increasing amounts of pOSML-COX-2 (0–4 μg) and incubation for 24 h, the supernatants of HEK293T cells were collected and PGE2 concentration (ng/ml) was quantified as described (Materials and Methods). Data from three independent experiments were averaged (mean ± SEM). Statistically significant differences detected by multiple comparisons using ANOVA are indicated; *p < 0.01; #p < 0.05. (E) HEK293T cells were transiently transfected with pOSML-COX-2 and pLacIOP or pLacIOP-caveolin-1 (2 μg each plasmid).Twenty-four hours after transfection cell proliferation was measured by the MTS assay. Data from three independent experiments were averaged (mean ± SEM). Statistically significant differences between cells transfected with pLacIOP-caveolin-1 or pLacIOP-caveolin-1/pOSML-COX-2 are indicated; #p < 0.05.
Figure 5.
Figure 5.
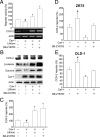
PGE2 increased survivin and COX-2 expression via the β-catenin-Tcf/Lef pathway, as well as proliferation in HEK293T cells. (A) HEK293T cells were transfected with reporter plasmids for the Tcf/Lef (pTOP-FLASH or pFOP-FLASH), survivin (pLuc-1710 or pLuc-420–3M), and COX-2 (pGL3-COX-2 or pGL3) promoters. After transfection, cells were serum-starved for 12 h and then incubated 4 h with serum-free medium containing PGE2 (5 μM). Cell extracts were prepared and luciferase activity was determined as described (Materials and Methods). Results were normalized to values obtained for cells without PGE2. Data shown are averaged from three independent experiments (mean ± SEM). Statistically significant differences are indicated; *p < 0.01; #p < 0.05. (B) Total RNA was isolated from cells treated the same way as in A. The mRNA levels of COX-2 and survivin were determined by semiquantitative RT-PCR using actin as a control. Relative mRNA levels compared with controls estimated by scanning densitometry were 2.0 ± 0.03 for survivin and 1.4 ± 0.06 for COX-2. Differences compared with nontransfected cells were statistically significant; #p < 0.05. (C and D) Real-time qPCR analysis of COX-2 and survivin mRNA levels from samples obtained as indicated in A. Ribosomal 18S RNA was used as an internal control. Statistically significant differences when compared with nontreated cells are indicated; *p < 0.01; #p < 0.05. (E) Protein extracts from cells obtained as in A were separated by SDS-PAGE (80 μg/lane) and analyzed by Western blotting with anti-COX-2, anti-β-catenin, anti-survivin, or anti-actin antibodies. Numerical data were obtained by scanning densitometric analysis and normalized to actin. Compared with controls, protein levels in the presence of PGE2 were 1.55 ± 0.03 for COX-2, 1.35 ± 0.05 for β-catenin, and 1.74 ± 0.04 for survivin. (F) Cell proliferation was measured by MTS assay in HEK293T cells cultured 12 h in serum-free medium and then incubated 16 h in serum-free medium containing PGE2 (5 μM). Data from three independent experiments (mean ± SEM) are shown. Statistically significant differences when compared with nontreated cells are indicated; #p < 0.05.
Figure 6.
Figure 6.
Caveolin-1 expression decreased PGE2 production in embryonic kidney and cancer cell lines. Quantification of PGE2 production by an immunodetection method. Results for HEK293T (A), ZR75 (B), DLD-1 (C), or HT29(ATCC) (D) cells transiently (for embryonic HEK293T) or stably (cancer cells) transfected with the plasmids pLacIOP (−) or pLacIOP-caveolin-1 (+), □ and ■, respectively, are shown. Cells (2 × 10⁶) were seeded in 60-mm plates and grown in all cases for 24 h in presence of 1 mM IPTG. Supernatants were collected and quantified with the PGE2 EIA monoclonal kit. Data averaged from three independent experiments are shown (mean ± SEM). Statistically significant differences with respect to mock controls found in A, C, and D are indicated; #p < 0.05.
Figure 7.
Figure 7.
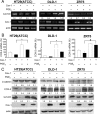
PGE2 reverted caveolin-1–mediated inhibition of COX-2 and survivin expression in cancer cell lines. The colon [HT29(ATCC), DLD-1] and breast (ZR75) cancer cell lines stably transfected with pLacIOP (−) or pLacIOP-caveolin-1 (+) were incubated 24 h either in the presence of 1 mM IPTG or 1 mM IPTG and 3 h with 20 μM PGE2 in serum-free medium. (A) Survivin, caveolin-1, and actin mRNA levels were analyzed by semiquantitative RT-PCR. Actin was used as an internal control. Numerical data averaged from three independent experiments after standardization to actin are shown (means). (B) Quantitative qPCR analysis of COX-2 mRNA levels in colon [HT29(ATCC), DLD-1] and breast (ZR75) cancer cell lines treated as described in A. Ribosomal 18S RNA was used as an internal control. Values shown were averaged from three independent experiments (mean ± SEM). (C) Western blot of the same samples as in A. Total protein extracts were separated by SDS-PAGE (80 μg/lane) and analyzed by Western blotting using anti-β-catenin, anti-COX-2, anti-survivin, anti-caveolin-1, or anti-actin antibodies. Numerical data were averaged from three independent experiments after standardization to actin (means). Statistically significant differences found in A–C between results for cells transfected with pLacIOP-caveolin-1 and cultured in the absence or presence of PGE2 (20 μM) are indicated; *p < 0.01; #p < 0.05.
Figure 8.
Figure 8.
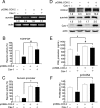
COX-2 overexpression prevented caveolin-1–mediated inhibition of transcription and proliferation in DLD-1 cells. The DLD-1 colon cancer cells stably transfected with pLacIOP (−; □) or pLacIOP-caveolin-1 (+; ■) were additionally transfected with pOSML-COX-2 (2 μg). For reporter assays (B and C), DLD-1 cells were also cotransfected with 1.0 μg of the different luciferase reporter plasmids: pTOP-FLASH, pFOP-FLASH, pLuc-1710, or pLuc-420–3M. Then, DLD-1 cells were incubated 24 h in the presence of 1 mM IPTG. (A) The mRNA levels of survivin were determined by semiquantitative RT-PCR analysis. Actin was used as an internal control, and numbers between panels represent the average from two independent experiments. Residual survivin mRNA levels in the presence of caveolin-1 (pLacIOP-caveolin-1) increased from 0.4–1.7 upon cotransfection with pOSML-COX-2. (B and C) Luciferase activity was determined and normalized by calculating the pTOP-FLASH/pFOP-FLASH and pLuc-1710/pLuc-420–3M activity ratios, respectively. Values were standardized relative to those obtained for control cells not transfected with the plasmid encoding COX-2 (100%). Data shown were averaged from three independent experiments (mean ± SEM). Statistically significant differences are indicated; *p < 0.01; #p < 0.05. (D) Western blot analysis of DLD-1 cells. Total protein extracts (50 μg/lane) were separated by SDS-PAGE and analyzed by Western blotting with anti-COX-2, anti-survivin, anti-caveolin-1, or anti-actin antibodies. Numerical data were obtained by scanning densitometric analysis. Values shown were normalized to actin and averaged from two independent experiments. Residual survivin protein levels in the presence of caveolin-1 (pLacIOP-caveolin-1) increased from 0.5 to 2.0 upon cotransfection with pOSML-COX-2. (E) After cotransfection, as described above, the supernatants from DLD-1 cells were collected and PGE2 concentrations (ng/ml) were quantified as described in Materials and Methods. Data averaged from three independent experiments are shown (mean ± SEM). Statistically significant differences are indicated; *p < 0.01; #p < 0.05. (F) DLD-1 cells stably transfected with pLacIOP (−) or pLacIOP-caveolin-1 (+) and additionally transfected with pOSML-COX-2 (2 μg). Then, DLD-1 cells were seeded in 96-well plates and cultured 24 h in the presence of 1 mM IPTG. Cell proliferation was measured using the MTS assay. Data from three independent experiments (mean ± SEM) are shown. The p value shown (p = 0.054) refers to the difference in proliferation between DLD-1 cells stably transfected with pLacIOP-caveolin-1 alone or additionally transfected with pOSML-COX-2.
Figure 9.
Figure 9.
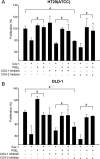
PGE2 prevented inhibition of proliferation in cancer cell lines due to caveolin-1 expression or the presence of a COX-2 inhibitor. Proliferation was assessed using the MTS assay in HT29(ATCC) (A) and DLD-1 (B) colon cancer cells stably transfected with pLacIOP (−) or pLacIOP-caveolin-1 (+). After serum starvation for 4 h and incubation for 3 h with PGE2 (20 μM) in serum-free media, cells were grown for 24 h in the presence of IPTG (1 mM) and either 10 μM of the COX-1 inhibitor (FR122047) or 20 μM of the COX-2 inhibitor II (SC-791). Results were normalized to values in control cells (100%) transfected with the empty vector (pLacIOP). Data shown were averaged from three independent experiments (mean ± SEM). Statistically significant differences detected by multiple comparisons using ANOVA in A and B are indicated; #p < 0.05.
Figure 10.
Figure 10.
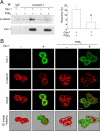
PGE2 increased nuclear β-catenin localization and reduced the ability of caveolin-1 to sequester β-catenin to the plasma membrane. (A) HT29(ATCC) cells stably transfected with pLacIOP-caveolin-1 (+) or pLacIOP (−) were incubated 24 h in the presence of 1 mM IPTG. Then, cells were serum-starved for 4 h and incubated 3 h in serum-free medium containing 20 μM PGE2. After incubation, caveolin-1 and β-catenin protein levels were assessed in caveolin-1 immunoprecipitates by Western blotting. Numerical values in the bar graph indicate the percentage of β-catenin recovered (recovery %) in caveolin-1 immunoprecipitates averaged from four independent experiments corrected in each case for the efficiency of caveolin-1 recovery in immunoprecipitates. Statistically significant differences are indicated; #p < 0.05. (B) Cells were grown on glass coverslips and treated as described in A. Samples were analyzed by indirect immunofluorescence and confocal microscopy. Cellular localization of caveolin-1 (green) and β-catenin (red) are shown. Merged images were generated using the Imaris software program (Bitplane, Zurich, Switzerland), whereby a third pseudocolor channel (yellow) was used to show colocalization of red and green pixels. The software provides an automated selection of colocalization based on previously described algorithms (Costes et al., 2004). Z-Stacks obtained from the same samples were processed using Imaris software. The laser confocal image z-stack is visualized three-dimensionally using the isosurface processing mode that creates an artificial real volume object from available voxels. The isosurface image of a group of cells was rotated and virtually clipped at 5 μm from the coverslip surface to visualize better the nuclei. The resulting images are indicated as 3D merge +clipping.
Figure 11.
Figure 11.
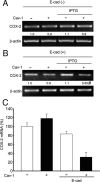
Caveolin-1–mediated reduction of COX-2 mRNA levels was restored in the HT29(US) colon cancer cell line by ectopic E-cadherin expression. The HT29(US) (E-cad/−) cells stably transfected with pLacIOP (−) or pLacIOP-caveolin-1 (+) were incubated 24 h in the absence or presence of 1 mM IPTG. (A) COX-2 and actin mRNA levels were analyzed by semiquantitative RT-PCR. Actin was used as an internal control. Numerical data averaged from three independent experiments after standardization to actin are shown (B) HT29(US) cells were cotransfected with pBATEM2 (E-cad/+) and pLacIOP (−) or pLacIOP-caveolin-1 (+) and grown for 24 h in the absence or presence of 1 mM IPTG. For cotransfection experiments, 2 μg of each plasmid were used. COX-2 mRNA levels were assessed as described in A. Numerical data averaged from three independent experiments after standardization to actin are shown (mean ± SEM). COX-2 levels in E-cadherin and caveolin-1–expressing cells were 0.65 ± 0.14. Statistically significant differences between results for cells cotransfected with pLacIOP/pBATEM2 or pLacIOP-caveolin-1/pBATEM2 are indicated; #p < 0.05. (C) Real-time qPCR analysis of COX-2 mRNA levels in HT29(US) cells cotransfected as in B. Numerical data averaged from two independent experiments in triplicate after standardization to ribosomal 18S RNA are shown (mean ± SEM).
Figure 12.
Figure 12.
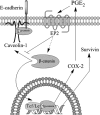
Schematic summary of data. Our previous studies showed that caveolin-1 suppresses β-catenin-Tcf/Lef activity by sequestering β-catenin to the plasma membrane in a complex with E-cadherin and thereby inhibits survivin expression (Torres et al., 2006). The results obtained here additionally show that caveolin-1 suppressed the expression of COX-2 by essentially the same transcriptional mechanism in HEK293T, colon [HT29(ATCC) and DLD-1], and breast (ZR75) cancer cell lines. Moreover, caveolin-1 expression generally correlated with reduced presence of PGE2 in the culture medium. Importantly, caveolin-1–mediated inhibition of β-catenin-Tcf/Lef–dependent transcription and survivin expression were prevented either by ectopic expression of COX-2 or by incubation with PGE2. Thus, caveolin-1–dependent regulation of survivin, COX-2, and presumably other β-catenin-Tcf/Lef target genes involves not only inhibition of transcription by sequestration of β-catenin to the plasma membrane in a complex with E-cadherin, but also suppression of this posttranscriptional COX-2-PGE2 amplification loop. Alternatively, our data also indicate that PGE2 blocks the ability of caveolin-1 to sequester β-catenin to the plasma membrane, although the precise mechanism by which this occurs remains to be established. In agreement with results obtained by others (Castellone et al., 2005, 2006), PGE2 is suggested here to enhance β-catenin stability in the cytosol via an EP2 receptor–dependent mechanism. In addition, although speculative, this same sequence is suggested to block efficient formation of the caveolin-1/E-cadherin/β-catenin complex at the cell surface.

Similar articles

Cited by

References

    1. Araki Y., Okamura S., Hussain S. P., Nagashima M., He P., Shiseki M., Miura K., Harris C. C. Regulation of cyclooxygenase-2 expression by the Wnt and ras pathways. Cancer Res. 2003;63:728–734. - PubMed
    1. Backlund M. G., Mann J. R., Dubois R. N. Mechanisms for the prevention of gastrointestinal cancer: the role of prostaglandin E2. Oncology. 2005;69(Suppl 1):28–32. - PubMed
    1. Baratelli F., Krysan K., Heuze-Vourc'h N., Zhu L., Escuadro B., Sharma S., Reckamp K., Dohadwala M., Dubinett S. M. PGE2 confers survivin-dependent apoptosis resistance in human monocyte-derived dendritic cells. J. Leukoc. Biol. 2005;78:555–564. - PubMed
    1. Bender F. C., Reymond M. A., Bron C., Quest A. F. Caveolin-1 levels are down-regulated in human colon tumors, and ectopic expression of caveolin-1 in colon carcinoma cell lines reduces cell tumorigenicity. Cancer Res. 2000;60:5870–5878. - PubMed
    1. Castellone M. D., Teramoto H., Gutkind J. S. Cyclooxygenase-2 and colorectal cancer chemoprevention: the beta-catenin connection. Cancer Res. 2006;66:11085–11088. - PubMed

Publication types

MeSH terms