

A viscerally driven cachexia syndrome in patients with advanced colorectal cancer: contributions of organ and tumor mass to whole-body energy demands
- PMID: 19244378
- PMCID: PMC2667460
- DOI: 10.3945/ajcn.2008.27273
A viscerally driven cachexia syndrome in patients with advanced colorectal cancer: contributions of organ and tumor mass to whole-body energy demands
Abstract
Background: Cancer cachexia-associated weight loss is poorly understood; energetically demanding tissues (eg, organ and tumor mass) and resting energy expenditure (REE) are reported to increase with advanced cancer.
Objective: The objective was to quantify the potential contribution of increasing masses of energetically demanding tissues to REE with colorectal cancer cachexia progression.
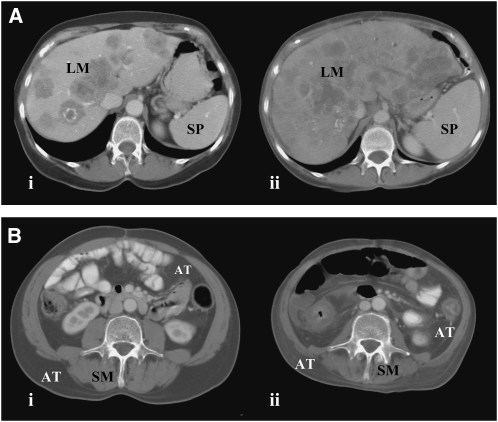
Design: A longitudinal computed tomography (CT) image review was performed to quantify organ size (liver, including metastases, and spleen) and peripheral tissues (skeletal muscle and adipose tissue) during colorectal cancer cachexia progression (n = 34). Body composition was prospectively evaluated by CT and dual-energy X-ray absorptiometry, and REE was determined by indirect calorimetry in advanced colorectal cancer patients (n = 18).
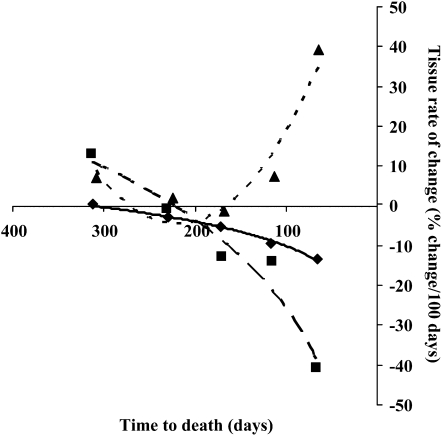
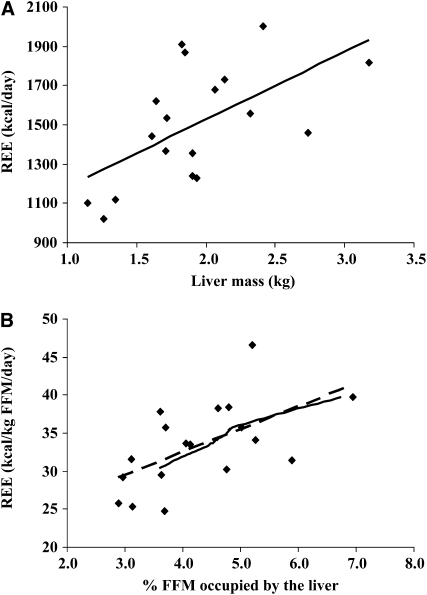
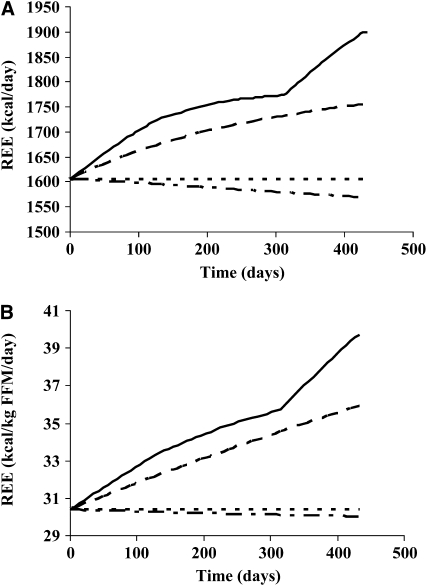
Results: Eleven months from death, the liver (2.3 +/- 0.7 kg) and spleen (0.32 +/- 0.2 kg) were larger than reference values. One month from death, liver weight increased to 3.0 +/- 1.5 kg (P = 0.010), spleen showed a trend to increase (P = 0.077), and concurrent losses of muscle (4.2 kg) and fat (3.5 kg) (P < 0.05) were observed. The estimated percentage of fat-free mass (FFM) occupied by the liver increased from 4.5% to 7.0% (P < 0.001). The most rapid loss of peripheral tissues and liver and metastases gain occurred within 3 mo of death. A positive linear relation existed between liver mass and measured whole-body REE (r(2) = 0.35, P = 0.010); because liver accounted for a larger percentage of FFM, measured REE . kg FFM(-1) . d(-1) increased (r(2) = 0.35, P = 0.010).
Conclusions: Increases in mass and in the proportion of high metabolic rate tissues, including liver and tumor, represented a cumulative incremental REE of approximately 17,700 kcal during the last 3 mo of life and may contribute substantially to cachexia-associated weight loss.
Figures
References
-
- Delano MJ, Moldawer LL. The origins of cachexia in acute and chronic inflammatory diseases. Nutr Clin Pract 2006;21:68–81 - PubMed
-
- Laviano A, Meguid MM, Inui A, Muscaritoli M, Rossi-Fanelli F. Therapy insight: cancer anorexia-cachexia syndrome—when all you can eat is yourself. Nat Clin Pract Oncol 2005;2:158–65 - PubMed
-
- Baracos VE. Cancer-associated cachexia and underlying biological mechanisms. Annu Rev Nutr 2006;26:435–61 - PubMed
-
- Elia M. Tissue distribution and energetics in weight loss and undernutrition. Kinney J, Tucker H, eds Physiology, stress, and malnutrition: functional correlates, nutritional intervention. Philadelphia, PA: Lippincott-Raven, 1997:383–411
-
- Elia M. Organ and tissue contribution to metabolic rate. Kinney J, Tucker H, eds Energy metabolism: tissue determinants and cellular corollaries. New York, NY: Raven Press, 1992:61–77
Publication types
MeSH terms
Grants and funding
LinkOut - more resources
Full Text Sources
Other Literature Sources
Medical
