. 2009 Apr;296(4):C701-10.
doi: 10.1152/ajpcell.00633.2008. Epub 2009 Feb 25.

State-dependent block of HERG potassium channels by R-roscovitine: implications for cancer therapy

Affiliations

State-dependent block of HERG potassium channels by R-roscovitine: implications for cancer therapy

Sindura B Ganapathi et al. Am J Physiol Cell Physiol. 2009 Apr.

Abstract

Human ether-a-go-go-related gene (HERG) potassium channel acts as a delayed rectifier in cardiac myocytes and is an important target for both pro- and antiarrhythmic drugs. Many drugs have been pulled from the market for unintended HERG block causing arrhythmias. Conversely, recent evidence has shown that HERG plays a role in cell proliferation and is overexpressed both in multiple tumor cell lines and in primary tumor cells, which makes HERG an attractive target for cancer treatment. Therefore, a drug that can block HERG but that does not induce cardiac arrhythmias would have great therapeutic potential. Roscovitine is a cyclin-dependent kinase (CDK) inhibitor that is in phase II clinical trials as an anticancer agent. In the present study we show that R-roscovitine blocks HERG potassium current (human embryonic kidney-293 cells stably expressing HERG) at clinically relevant concentrations. The block (IC(50) = 27 microM) was rapid (tau = 20 ms) and reversible (tau = 25 ms) and increased with channel activation, which supports an open channel mechanism. Kinetic study of wild-type and inactivation mutant HERG channels supported block of activated channels by roscovitine with relatively little effect on either closed or inactivated channels. A HERG gating model reproduced all roscovitine effects. Our model of open channel block by roscovitine may offer an explanation of the lack of arrhythmias in clinical trials using roscovitine, which suggests the utility of a dual CDK/HERG channel block as an adjuvant cancer therapy.


Figures
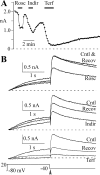
Fig. 1.
Fig. 1.
Comparison of the effects of roscovitine, indirubin, and terfenadine on human ether-a-go-go-related gene (HERG). A: peak tail currents were measured from a representative cell (same as in B) showing the time course of inhibition and recovery from inhibition for 30 μM R-roscovitine (Rosc), 30 μM indirubin-3′-monoxime (Indir), and 0.1 μM terfenadine (Terf). On average, inhibitions were 49 ± 9% (SD) for Rosc (n = 10), 61 ± 11% for Indir (n = 4), and 89 ± 7% (n = 6) for Terf. Step currents were generated by 1-s steps to +20 mV, and tail currents were generated by a 1-s repolarization to −60 mV. The interval between sweeps was 20 s. Note the differences in the speed of inhibition induced in each of these drugs. B: representative current traces from A with the voltage protocol shown below. The arrowhead indicates the point at which peak tail currents were measured. Cntl, control; Recov, recovery.
Fig. 2.
Fig. 2.
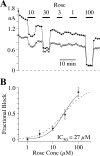
Concentration-dependent block of HERG by Rosc. A: a representative cell shows the time course of inhibition for 1, 3, 10, 30, and 100 μM Rosc. Step currents (○) were measured at the end of the 1-s step to +20 mV. The voltage protocol and peak tail current measurements (•) are the same as shown in Fig. 1B. B: dose-response relationship showing the fractional block of tail currents by Rosc. The smooth solid line is a fit using the Hill equation to generate IC50 = 27 μM and Hill coefficient = 1.4, while the dashed line shows the fit with Hill coefficient fixed to 1 (n = 6–10).
Fig. 3.
Fig. 3.
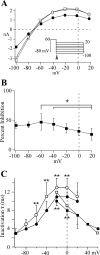
Rosc block increases with step depolarization. A: HERG currents from a representative cell are shown for voltage steps to −20, 0, and +20 mV. The tail currents were generated on hyperpolarization to −40 mV. The Rosc concentration was 30 μM. Control (Cntl; before Rosc application), Rosc (during Rosc application), and recovery (Recov; on recovery from Rosc application) currents are represented. The arrowhead indicates the point at which peak tail currents were measured. B: the step current vs. step voltage relationship (I-V) is shown for the representative cell from A. Step currents were measured at the end of the 4-s step ranging from −60 to +40 mV (20-mV increments). Values are shown for control (▵), 30 μM Rosc (•), and on recovery (▿). C: peak tail currents are plotted vs. step voltage (symbols same as in B) for the same representative cell (A and B). The smooth lines represent single Boltzmann fits to generate V0.5 = −7, −11, and −7 mV, slope = 7, 7, and 7, and maximum current = 1.7, 0.8, and 1.5 nA for control, 30 μM Rosc, and recovery, respectively. D: comparison of the percent inhibition of peak tail currents induced by 30 μM Rosc shows significantly lower inhibition at −20 vs. 0 (b), +20 (c), and +40 mV (d) (P < 0.01 for each comparison, ANOVA; n = 6).
Fig. 4.
Fig. 4.
Increased Rosc block of tail current with hyperpolarization. A: the peak tail current vs. tail voltage relationship is shown for a representative cell. Peak tail currents were measured at voltages ranging from 20 to −100 mV (20-mV increments) following a 1-s step to 60 mV to activate HERG channels (inset) and are plotted vs. tail voltage for control (▵), 30 μM Rosc (•), and recovery (▿). The arrowhead on the voltage protocol indicates the point at which the tail current was measured. B: percent inhibition of IHERG by 30 μM Rosc from the voltage protocol shown in A. Percent inhibition at different tail voltages is plotted vs. tail voltage. Inhibition at 20 mV was significantly different (*P < 0.05, n = 5) from that at −40 and −60 mV (ANOVA). C: Rosc decreases inactivation kinetics only at intermediate voltages. The recovery from inactivation τ (circles, n = 6) was measured (single exponential equation) from the raising phase of the tail current upon hyperpolarization from +60 mV to the indicated voltage (x-axis). The development of inactivation τ (squares, n = 4) was measured from a triple-pulse protocol where voltage was stepped to +60 (500 ms), −100 (10 ms), and the indicated voltage (x-axis) for 250 ms. A single exponential equation was used to fit inactivation during the third voltage step. Data are shown for control (average of values before and after Rosc) and during the application of 30 μM Rosc (open and closed symbols, respectively) (**P < 0.01).
Fig. 5.
Fig. 5.
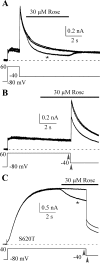
Rosc blocks open, but not inactivated, HERG channels. A: HERG channels were activated by a 1-s step to +60 mV, and tail current was measured during a 10-s step to −40 mV. Three pulses were given at 1-min intervals between the pulses. During the tail current of the second pulse (*), 30 μM Rosc was rapidly applied and removed for the duration shown by the black bar. The remaining two traces show the current without Rosc application that were recorded 1 min before and 1 min following the Rosc-exposed trace. On average, Rosc blocked the HERG tail current by 38 ± 8% (n = 4). B: current was elicited by an 8-s step to +60 mV, and tail currents were measured at −40 mV. Rosc (30 μM) was rapidly applied during the step and continued into the tail as indicated by the black bar. The superimposed control and recovery currents were recorded 1 min before and after the Rosc-exposed trace, respectively. On average, Rosc block of HERG current at the end of the voltage step to +60 mV was 14 ± 7%, which increased to 29 ± 7% (P < 0.05) on hyperpolarization to −40 mV (n = 7). The arrowheads on the voltage protocol indicate the approximate points at which the step and tail currents were measured. C: the same experiment presented in B was repeated with the inactivation-impaired HERG mutant S620T. The superimposed control current was recorded 1 min before the Rosc-exposed current (*). Unlike the wild-type HERG, S620T currents were equally blocked at +40 mV (step) and −40 mV (peak tail) by application of Rosc (20 ± 6% and 23 ± 6% for step and peak tail currents, respectively, P = 0.45, n = 5). The arrowheads on the voltage protocol indicate the approximate points at which the step and peak tail currents were measured.
Fig. 6.
Fig. 6.
Inactivated channels are insensitive to Rosc. A: HERG currents were activated by a 3-s step to 20-mV, followed by a 1-s hyperpolarization to −40 mV and a return to +20 mV. Representative currents from a single cell are shown. B: the ratio current generated from the currents in A is displayed as percent inhibition by 30 μM Rosc and shows rapid block at the onset of the voltage step from −80 to +20 mV (1); slower unblock during the sustained +20-mV step (2); rapid reblock on hyperpolarization to −40 mV (3); and rapid unblock on returning to +20 mV (4). The ratio current was generated by the formula (Cntl − Rosc)/Cntl, where Cntl is the average of currents before and on recovery from Rosc application. The smooth gray lines are single exponential fits to obtain the τ for initial block, slower unblock during the step to +20 mV, increased block at −40 mV, and decreased block at +20 mV. C: 30 μM Rosc inhibits both step and tail currents (from a representative cell) obtained from inactivation-impaired mutant S620T. D: ratio currents obtained for currents shown in C. Notice that the inhibition increases with current activation and remains relatively stable during the +20-mV step. The arrow marks the repolarization to −40 mV to highlight the absence of the increase of inhibition observed in wild-type HERG.
Fig. 7.
Fig. 7.
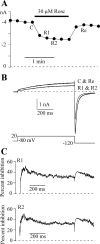
Rosc is not trapped by HERG channel closing at −120 mV. A: peak tail currents were measured at −120 mV following 700-ms voltage steps to +20 mV. The interval between sweeps was 20 s. C (control), R1 (Rosc sweep 1), R2 (Rosc sweep 2), and Re (recovery) indicate sweeps shown in B. B: current traces are shown before, two times during, and on recovery from 30 μM Rosc along with the voltage protocol. C: ratio currents are depicted for both R1 and R2 currents (successive current traces in Rosc). Note the rapid onset of inhibition at the beginning of both R1 and R2, which shows that Rosc unbound during the 20-s interval between sweeps.
Fig. 8.
Fig. 8.
Gating model [based on Wang et al. (42)] of mechanism of preferential block of activated HERG channels by Rosc.
Fig. 9.
Fig. 9.
A gating model reproduces Rosc block of HERG channels. A: currents were simulated using a 4-s step to the indicated voltage (x-axis) followed by a 1-s step to −40 mV. Peak tail currents were measured during the −40-mV step and normalized to the current following the +60-mV step. The simulated data are shown for control (▵) and 30 μM Rosc (•). The smooth lines are single Boltzmann equation fits to the experimental data to illustrate the close correspondence with the simulation data. B: the percent inhibition of tail current vs. step voltage by 30 μM Rosc is shown for both simulated (▪) and experimental data (□, reproduced from Fig. 3D). C: the time course of 30 μM Rosc block of simulated current is shown for a 3-s step to +20 mV, which is followed by a 50-ms step to −40 mV and a subsequent return to +20 mV for 3 s. The simulated currents are shown for control (gray trace) and Rosc (black trace). D: the ratio current is shown as percent inhibition and was calculated from the above records in C (cf. Fig 6B).

Similar articles

Cited by

References

    1. Arcangeli A Expression and role of hERG channels in cancer cells. Novartis Found Symp 266: 225–232; discussion 232–224, 2005. - PubMed
    1. Becchetti A, Arcangeli A. A comment on ion channels as pharmacological targets in oncology. J Gen Physiol 132: 313–314, 2008. - PMC - PubMed
    1. Benson C, White J, De Bono J, O'Donnell A, Raynaud F, Cruickshank C, McGrath H, Walton M, Workman P, Kaye S, Cassidy J, Gianella-Borradori A, Judson I, Twelves C. A phase I trial of the selective oral cyclin-dependent kinase inhibitor seliciclib (CYC202; R-roscovitine), administered twice daily for 7 days every 21 days. Br J Cancer 96: 29–37, 2007. - PMC - PubMed
    1. Bril A, Gout B, Bonhomme M, Landais L, Faivre JF, Linee P, Poyser RH, Ruffolo RR Jr. Combined potassium and calcium channel blocking activities as a basis for antiarrhythmic efficacy with low proarrhythmic risk: experimental profile of BRL-32872. J Pharmacol Exp Ther 276: 637–646, 1996. - PubMed
    1. Buraei Z, Anghelescu M, Elmslie KS. Slowed N-type calcium channel (CaV2.2) deactivation by the cyclin-dependent kinase inhibitor roscovitine. Biophys J 89: 1681–1691, 2005. - PMC - PubMed

Publication types

MeSH terms

LinkOut - more resources