

A loss of parvalbumin-containing interneurons is associated with diminished oscillatory activity in an animal model of schizophrenia
- PMID: 19244511
- PMCID: PMC2754752
- DOI: 10.1523/JNEUROSCI.5419-08.2009
A loss of parvalbumin-containing interneurons is associated with diminished oscillatory activity in an animal model of schizophrenia
Abstract
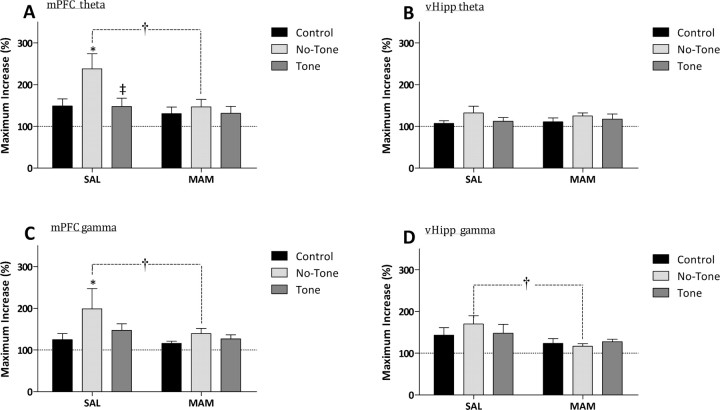
Decreased GABAergic signaling is among the more robust pathologies observed postmortem in schizophrenia; however, the functional consequences of this deficit are still largely unknown. Here, we demonstrate, in a verified animal model of schizophrenia, that a reduced expression of parvalbumin (PV)-containing interneurons is correlated with a reduction in coordinated neuronal activity during task performance in freely moving rats. More specifically, methylazoxymethanol acetate (MAM)-treated rats display a decreased density of parvalbumin-positive interneurons throughout the medial prefrontal cortex (mPFC) and ventral (but not dorsal) subiculum of the hippocampus. Furthermore, the reduction in interneuron functionality is correlated with a significantly reduced gamma-band response to a conditioned tone during a latent inhibition paradigm. Finally, deficits in mPFC and ventral hippocampal oscillatory activity are associated with an impaired behavioral expression of latent inhibition in MAM-treated rats. Thus, we propose that a decrease in intrinsic GABAergic signaling may be responsible, at least in part, for the prefrontal and hippocampal hypofunctionality observed during task performance, which is consistently observed in animal models as well as in schizophrenia in humans. In addition, a deficit in intrinsic GABAergic signaling may be the origin of the hippocampal hyperactivity purported to underlie the dopamine dysfunction in psychosis. Such information is central to gaining a better understanding of the disease pathophysiology and alternate pharmacotherapeutic approaches.
Figures


Similar articles
-
Loss of Parvalbumin in the Hippocampus of MAM Schizophrenia Model Rats Is Attenuated by Peripubertal Diazepam.Int J Neuropsychopharmacol. 2016 Dec 3;19(11):pyw065. doi: 10.1093/ijnp/pyw065. Print 2016 Nov. Int J Neuropsychopharmacol. 2016. PMID: 27432008 Free PMC article.
-
Afferent drive of medial prefrontal cortex by hippocampus and amygdala is altered in MAM-treated rats: evidence for interneuron dysfunction.Neuropsychopharmacology. 2013 Sep;38(10):1871-80. doi: 10.1038/npp.2013.64. Epub 2013 Mar 7. Neuropsychopharmacology. 2013. PMID: 23471079 Free PMC article.
-
Corresponding decrease in neuronal markers signals progressive parvalbumin neuron loss in MAM schizophrenia model.Int J Neuropsychopharmacol. 2014 Oct;17(10):1609-19. doi: 10.1017/S146114571400056X. Epub 2014 Apr 30. Int J Neuropsychopharmacol. 2014. PMID: 24787547 Free PMC article.
-
Behavioral and neurochemical consequences of cortical oxidative stress on parvalbumin-interneuron maturation in rodent models of schizophrenia.Neuropharmacology. 2012 Mar;62(3):1322-31. doi: 10.1016/j.neuropharm.2011.01.049. Epub 2011 Feb 17. Neuropharmacology. 2012. PMID: 21315745 Free PMC article. Review.
-
Prefrontal and Hippocampal Parvalbumin Interneurons in Animal Models for Schizophrenia: A Systematic Review and Meta-analysis.Schizophr Bull. 2024 Jan 1;50(1):210-223. doi: 10.1093/schbul/sbad123. Schizophr Bull. 2024. PMID: 37584417 Free PMC article.
Cited by
-
Using animal models for the studies of schizophrenia and depression: The value of translational models for treatment and prevention.Front Behav Neurosci. 2022 Aug 24;16:935320. doi: 10.3389/fnbeh.2022.935320. eCollection 2022. Front Behav Neurosci. 2022. PMID: 36090659 Free PMC article. Review.
-
Selective dopamine D2 receptor deletion from Nkx6.2 expressing cells causes impaired cognitive, motivation and anxiety phenotypes in mice.Sci Rep. 2023 Nov 9;13(1):19473. doi: 10.1038/s41598-023-46954-8. Sci Rep. 2023. PMID: 37945756 Free PMC article.
-
Hippocampal atrophy is associated with psychotic symptom severity following traumatic brain injury.Brain Commun. 2021 Mar 9;3(2):fcab026. doi: 10.1093/braincomms/fcab026. eCollection 2021. Brain Commun. 2021. PMID: 33977261 Free PMC article.
-
Loss of Parvalbumin in the Hippocampus of MAM Schizophrenia Model Rats Is Attenuated by Peripubertal Diazepam.Int J Neuropsychopharmacol. 2016 Dec 3;19(11):pyw065. doi: 10.1093/ijnp/pyw065. Print 2016 Nov. Int J Neuropsychopharmacol. 2016. PMID: 27432008 Free PMC article.
-
Parvalbumin-positive GABAergic interneurons deficit in the hippocampus in Gunn rats: A possible hyperbilirubinemia-induced animal model of schizophrenia.Heliyon. 2019 Jul 5;5(7):e02037. doi: 10.1016/j.heliyon.2019.e02037. eCollection 2019 Jul. Heliyon. 2019. PMID: 31321330 Free PMC article.
References
-
- Abdul-Monim Z, Neill JC, Reynolds GP. Subchronic psychotomimetic phencyclidine induces deficits in reversal learning and alterations in parvalbumin-immunoreactive expression in the rat. J Psychopharmacol. 2007;21:198–205. - PubMed
-
- Abercrombie M. Estimation of nuclear population from microtome sections. Anat Rec. 1946;94:239–247. - PubMed
-
- Akbarian S, Kim JJ, Potkin SG, Hagman JO, Tafazzoli A, Bunney WE, Jr, Jones EG. Gene expression for glutamic acid decarboxylase is reduced without loss of neurons in prefrontal cortex of schizophrenics. Arch Gen Psychiatry. 1995;52:258–266. - PubMed
-
- Baeg EH, Kim YB, Jang J, Kim HT, Mook-Jung I, Jung MW. Fast spiking and regular spiking neural correlates of fear conditioning in the medial prefrontal cortex of the rat. Cereb Cortex. 2001;11:441–451. - PubMed
-
- Barch DM, Sheline YI, Csernansky JG, Snyder AZ. Working memory and prefrontal cortex dysfunction: Specificity to schizophrenia compared with major depression. Biological Psychiatry. 2003;53:376–384. - PubMed
Publication types
MeSH terms
Substances
Grants and funding
LinkOut - more resources
Full Text Sources
Other Literature Sources
Medical